Advertisements
Advertisements
प्रश्न
Plot the points (x, y) given by the following table:
| x | 2 | 4 | – 3 | – 2 | 3 | 0 |
| y | 4 | 2 | 0 | 5 | – 3 | 0 |
Advertisements
उत्तर
On plotting the given points on the graph, we get the points P(2, 4), Q(4, 2), R(–3, 0), S(–2, 5), T(3, – 3) and O(0, 0)

APPEARS IN
संबंधित प्रश्न
Write the equation of the line parallel to the Y-axis at a distance of 7 units from it to its left.
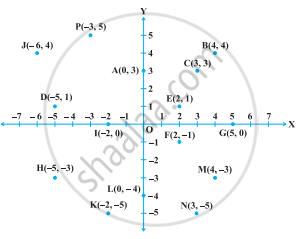
Some points are shown in the following figure. With the help of it answer the following questions:

- Write the co-ordinates of the points Q and R.
- Write the co-ordinates of the points T and M.
- Which point lies in the third quadrant?
- Which are the points whose x and y co-ordinates are equal?
Write down the abscissa and ordinate of the following.
S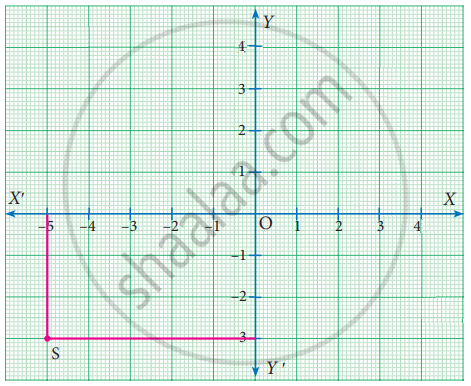
Plot the following points in the coordinate plane and join them. What is your conclusion about the resulting figure?
(−5, 3) (−1, 3) (0, 3) (5, 3)
Plot the following points in the coordinate plane and join them. What is your conclusion about the resulting figure?
(0, −4) (0, −2) (0, 4) (0, 5)
Plot the following point in a graph sheet.
G(7, −4)
Plot the following point in a graph sheet.
H(−4, 0)
Use the graph to determine the coordinates where each figure is located.
| a) Star | _______ |
| b) Bird | _______ |
| c) Red circle | _______ |
| d) Diamond | _______ |
| e) Triangle | _______ |
| f) Ant | _______ |
| g) Mango | _______ |
| h) Housefly | _______ |
| i) Medal | _______ |
| j) Spider | _______ |
If P(5, 1), Q(8, 0), R(0, 4), S(0, 5) and O(0, 0) are plotted on the graph paper, then the point(s) on the x-axis are ______.
From the figure, answer the following:
Write the points whose abscissa is – 5.