Advertisements
Advertisements
प्रश्न
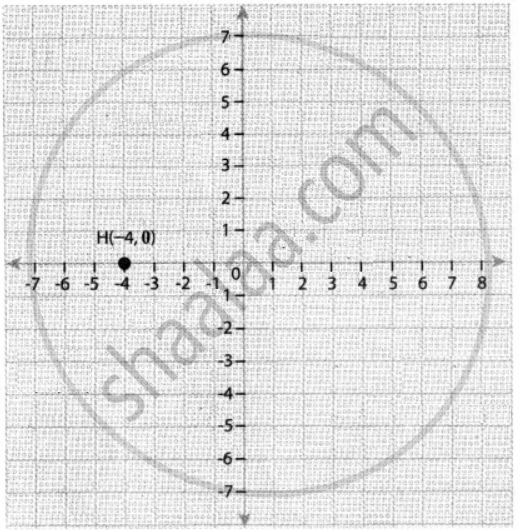
Plot the following point in a graph sheet.
H(−4, 0)
Advertisements
उत्तर
APPEARS IN
संबंधित प्रश्न
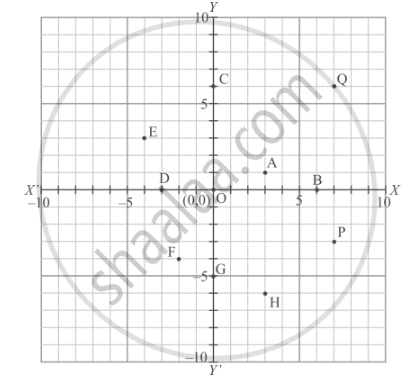
Write the coordinates of each of the following points marked in the graph paper:
Plot the following point on the graph paper:
(0, 7)
Plot the following point in the coordinate system and identify the quadrant.
T(3, 9)
Write down the abscissa and ordinate of the following.
R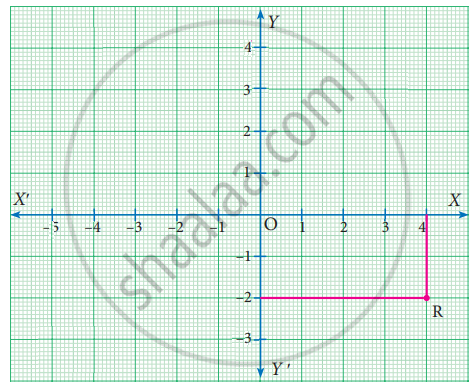
Write down the abscissa and ordinate of the following.
S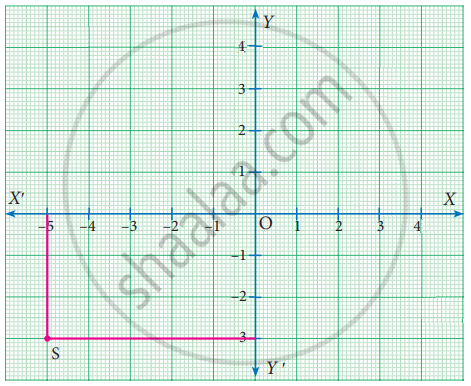
Plot the following points in the coordinate plane and join them. What is your conclusion about the resulting figure?
(0, −4) (0, −2) (0, 4) (0, 5)
If P(−1, 1), Q(3, −4), R(1, −1), S(−2, −3) and T(−4, 4) are plotted on a graph paper, then the points in the fourth quadrant are __________
Find the quadrants without plotting the point on a graph sheet
(3, −4)
Find the quadrants without plotting the point on a graph sheet.
(5, 7)
Plot the points A(1, – 1) and B(4, 5). Draw a line segment joining these points. Write the coordinates of a point on this line segment between the points A and B.
