Advertisements
Advertisements
प्रश्न
Some points are shown in the following figure. With the help of it answer the following questions:

- Write the co-ordinates of the points Q and R.
- Write the co-ordinates of the points T and M.
- Which point lies in the third quadrant?
- Which are the points whose x and y co-ordinates are equal?
Advertisements
उत्तर
(1) The x co-ordinate of a point is its distance from the Y-axis and the y co-ordinate of a point is its distance from the X-axis.
The co-ordinates of point Q are (−2, 2) and the co-ordinates of point R are (4, −1).
(2) The x co-ordinate of every point on the Y-axis is 0 and the y co-ordinate of every point on the X-axis is 0.
The co-ordinates of point T are (0, −1) and the co-ordinates of point M are (3, 0).
(3) The point whose x co-ordinate is negative and y co-ordinate is negative lies in the third quadrant.
Thus, the point S(−3, −2) lies in the third quadrant.
(4) The co-ordinates of point O are (0, 0).
Thus, O is the point whose x and y co-ordinates are equal.
APPEARS IN
संबंधित प्रश्न
Plot the following point on the graph paper:
(−4, 0)
Plot the following points on the one and the same co-ordinate system.
A(1, 3), B(-3, -1), C(1, -4), D(-2, 3), E(0, -8), F(1, 0)
Plot the following point in the coordinate system and identify the quadrant.
T(3, 9)
On plotting the points O(0, 0), A(3, 0), B(3, 4), C(0, 4) and joining OA, AB, BC and CO which of the following figure is obtained?
If P(−1, 1), Q(3, −4), R(1, −1), S(−2, −3) and T(−4, 4) are plotted on a graph paper, then the points in the fourth quadrant are __________
Plot the following point in a graph sheet.
A(5, 2)
Find the quadrants without plotting the point on a graph sheet.
(5, 7)
Find the quadrants without plotting the point on a graph sheet.
(2, 0)
Plot the following point in a graph sheet.
F(2, 0)
Plot the following point in a graph sheet.
H(−4, 0)
Find the quadrants without plotting the point on a graph sheet
(−7, 2)
Find the quadrants without plotting the point on a graph sheet.
(−9, 50)
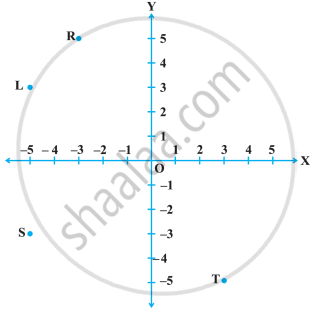
In the following figure, the point identified by the coordinates (–5, 3) is ______.
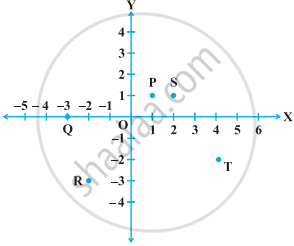
Write the coordinates of each of the points P, Q, R, S, T and O from the figure.
Taking 0.5 cm as 1 unit, plot the following points on the graph paper:
A(1, 3), B(– 3, – 1), C(1, – 4), D(– 2, 3), E(0, – 8), F(1, 0)
Points A(5, 3), B(– 2, 3) and D(5, – 4) are three vertices of a square ABCD. Plot these points on a graph paper and hence find the coordinates of the vertex C.
From the figure, answer the following:
Write the points whose ordinate is 0.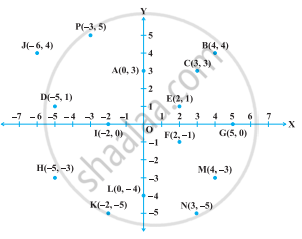
Plot the points A(1, – 1) and B(4, 5). Draw a line segment joining these points. Write the coordinates of a point on this line segment between the points A and B.
