Advertisements
Advertisements
प्रश्न
If P(–1, 1), Q(3, –4), R(1, –1), S(–2, –3) and T(–4, 4) are plotted on the graph paper, then the point(s) in the fourth quadrant are ______.
पर्याय
P and T
Q and R
Only S
P and R
Advertisements
उत्तर
If P(–1, 1), Q(3, –4), R(1, –1), S(–2, –3) and T(–4, 4) are plotted on the graph paper, then the point(s) in the fourth quadrant are Q and R.
Explanation:
In point P(–1, 1), x-coordinate is –1 unit and y-coordinate is 1 unit, so it lies in IInd quadrant.
Similarly, we can plot all the points Q(3, –4), R(1, –1), S(–2, –3) and T(–4, 4),
It is clear from the graph that points R and Q lie in fourth quadrant.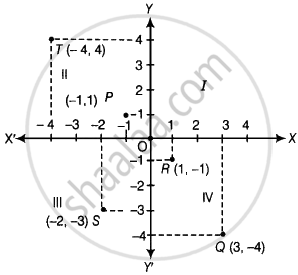
APPEARS IN
संबंधित प्रश्न
Plot the following point on the graph paper:
(7, −4)
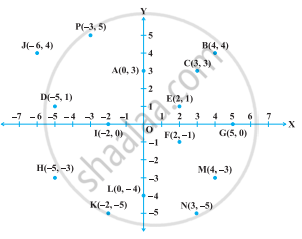
Some points are shown in the following figure. With the help of it answer the following questions:

- Write the co-ordinates of the points Q and R.
- Write the co-ordinates of the points T and M.
- Which point lies in the third quadrant?
- Which are the points whose x and y co-ordinates are equal?
Plot the following point in the coordinate system and identify the quadrant.
S(3, 5)
Plot the following point in the coordinate system and identify the quadrant.
T(3, 9)
Plot the following points in the coordinate plane and join them. What is your conclusion about the resulting figure?
(−5, 3) (−1, 3) (0, 3) (5, 3)
If P(−1, 1), Q(3, −4), R(1, −1), S(−2, −3) and T(−4, 4) are plotted on a graph paper, then the points in the fourth quadrant are __________
Plot the following point in a graph sheet.
E(0, −5)
Plot the following point in a graph sheet.
H(−4, 0)
Find the quadrants without plotting the point on a graph sheet.
(−9, 50)
From the figure, answer the following:
Write the points whose ordinate is 0.