Advertisements
Advertisements
Question
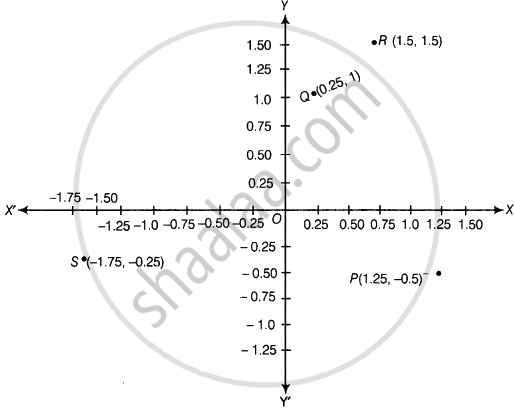
Plot the points (x, y) given by the following table. Use scale 1 cm = 0.25 units
| x | 1.25 | 0.25 | 1.5 | – 1.75 |
| y | – 0.5 | 1 | 1.5 | – 0.25 |
Advertisements
Solution
Let X’OX and Y’OX be the coordinate axes. Plot the given points (1.25, – 0.5), (0.25, 1), (1.5, 1.5) and (– 1.75, – 0.25) on the graph paper.
APPEARS IN
RELATED QUESTIONS
Plot the points (x, y) given in the following table on the plane, choosing suitable units of distance on the axes.
| x | -2 | -1 | 0 | 1 | 3 |
| y | 8 | 7 | -1.25 | 3 | -1 |
Plot the following point on the graph paper:
(2, 5)
Plot the following point on the graph paper:
(−3, 2)
Write the equation of the line parallel to the Y-axis at a distance of 7 units from it to its left.
Plot the following point in the coordinate system and identify the quadrant.
Q(7, −2)
Plot the following points in the coordinate plane and join them. What is your conclusion about the resulting figure?
(0, −4) (0, −2) (0, 4) (0, 5)
If P(−1, 1), Q(3, −4), R(1, −1), S(−2, −3) and T(−4, 4) are plotted on a graph paper, then the points in the fourth quadrant are __________
Find the quadrants without plotting the point on a graph sheet.
(−9, 50)
Plot the following point in a graph sheet.
I(2, 3)
In the following figure, coordinates of P are ______.