Advertisements
Advertisements
Question
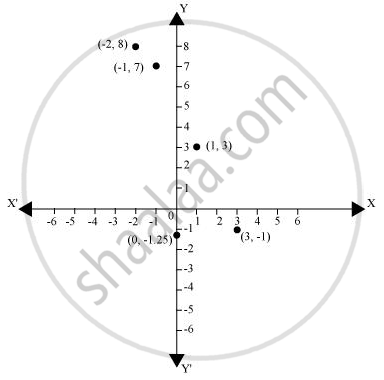
Plot the points (x, y) given in the following table on the plane, choosing suitable units of distance on the axes.
| x | -2 | -1 | 0 | 1 | 3 |
| y | 8 | 7 | -1.25 | 3 | -1 |
Advertisements
Solution
The given points can be plotted on the Cartesian plane as follows.
RELATED QUESTIONS
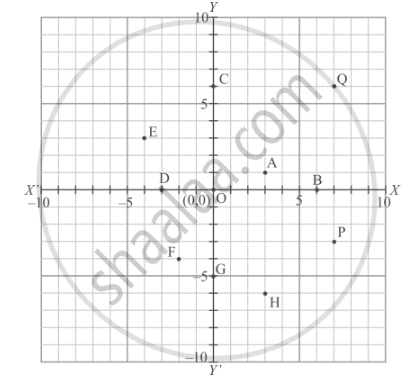
Write the coordinates of each of the following points marked in the graph paper:
Plot the following point on the graph paper:
(−3, 2)
Write the equation of the line parallel to the Y-axis at a distance of 7 units from it to its left.
Plot the following points in the coordinate plane and join them. What is your conclusion about the resulting figure?
(0, −4) (0, −2) (0, 4) (0, 5)
If the y-coordinate of a point is zero, then the point always lies ______
On plotting the points O(0, 0), A(3, 0), B(3, 4), C(0, 4) and joining OA, AB, BC and CO which of the following figure is obtained?
Plot the following point in a graph sheet.
D(−1, −1)
Plot the following point in a graph sheet.
G(7, −4)
Plot the following point in a graph sheet.
H(−4, 0)
Plot the following points and check whether they are collinear or not:
(0, 0), (2, 2), (5, 5)
