Advertisements
Advertisements
Question
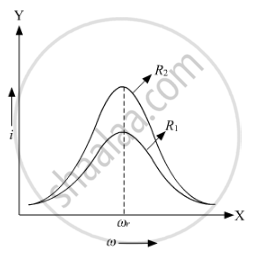
A series LCR circuit is connected across an a.c. source of variable angular frequency 'ω'. Plot a graph showing variation of current 'i' as a function of 'ω' for two resistances R1 and R2 (R1 > R2).
Answer the following questions using this graph :
(a) In which case is the resonance sharper and why?
(b) In which case in the power dissipation more and why?
Advertisements
Solution
he variation of current with angular frequency for the two resistances R1 and R2 is shown in the graph below.
Here,
i = Virtual current through the circuit
ω = Angular frequency of the source
ωr = Resonance frequency
From the graph, we can see that resonance for the resistance R2 is sharper than for R1 because resistance R2 is less than resistance R1. Therefore, at resonance, the value of peak current will rise more abruptly for a lower value of resistance.
b) Power associated with the resistance is given by
P=Ev Iv
where
Ev = Virtual voltage
Iv = Virtual current
From the graph, we can say that the virtual current in case of R2 is more than the virtual current in case of R1. Hence, the power dissipation in case of the circuit with R2 is more than that with R1.
APPEARS IN
RELATED QUESTIONS
Define 'quality factor' of resonance in a series LCR circuit. What is its SI unit?
Derive an expression for the average power consumed in a series LCR circuit connected to a.c. source in which the phase difference between the voltage and the current in the circuit is Φ.
The current in a discharging LR circuit without the battery drops from 2.0 A to 1.0 A in 0.10 s. (a) Find the time constant of the circuit. (b) If the inductance of the circuit 4.0 H, what is its resistance?
The potential difference across the resistor is 160V and that across the inductor is 120V. Find the effective value of the applied voltage. If the effective current in the circuit be 1.0 A, calculate the total impedance of the circuit.
In an L.C.R. series a.c. circuit, the current ______.
A series LCR circuit contains inductance 5 mH, capacitance 2µF and resistance ion. If a frequency A.C. source is varied, what is the frequency at which maximum power is dissipated?
A coil of 0.01 henry inductance and 1 ohm resistance is connected to 200 volt, 50 Hz ac supply. Find the impedance of the circuit and time lag between max. alternating voltage and current.
Draw the phasor diagram for a series LRC circuit connected to an AC source.
Draw the impedance triangle for a series LCR AC circuit and write the expressions for the impedance and the phase difference between the emf and the current.
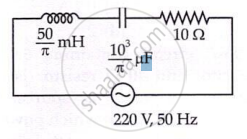
The net impedance of circuit (as shown in figure) will be ______.