Advertisements
Advertisements
प्रश्न
A series LCR circuit is connected across an a.c. source of variable angular frequency 'ω'. Plot a graph showing variation of current 'i' as a function of 'ω' for two resistances R1 and R2 (R1 > R2).
Answer the following questions using this graph :
(a) In which case is the resonance sharper and why?
(b) In which case in the power dissipation more and why?
Advertisements
उत्तर
he variation of current with angular frequency for the two resistances R1 and R2 is shown in the graph below.
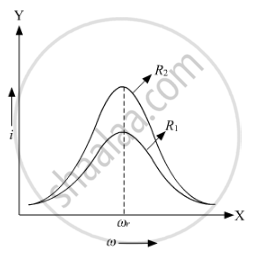
Here,
i = Virtual current through the circuit
ω = Angular frequency of the source
ωr = Resonance frequency
From the graph, we can see that resonance for the resistance R2 is sharper than for R1 because resistance R2 is less than resistance R1. Therefore, at resonance, the value of peak current will rise more abruptly for a lower value of resistance.
b) Power associated with the resistance is given by
P=Ev Iv
where
Ev = Virtual voltage
Iv = Virtual current
From the graph, we can say that the virtual current in case of R2 is more than the virtual current in case of R1. Hence, the power dissipation in case of the circuit with R2 is more than that with R1.
APPEARS IN
संबंधित प्रश्न
A coil having an inductance L and a resistance R is connected to a battery of emf ε. Find the time taken for the magnetic energy stored in the circuit to change from one fourth of the steady-state value to half of the steady-state value.
The potential difference across the resistor is 160V and that across the inductor is 120V. Find the effective value of the applied voltage. If the effective current in the circuit be 1.0 A, calculate the total impedance of the circuit.
Obtain the resonant frequency and Q-factor of a series LCR circuit with L = 3.0 H, C = 27 µF, and R = 7.4 Ω. It is desired to improve the sharpness of the resonance of the circuit by reducing its ‘full width at half maximum’ by a factor of 2. Suggest a suitable way.
If an LCR series circuit is connected to an ac source, then at resonance the voltage across ______.
At resonance frequency the impedance in series LCR circuit is ______.
A series LCR circuit containing a resistance of 120 Ω has angular resonance frequency 4 × 10⁵ rad s-1. At resonance the voltage across resistance and inductance are 60 V and 40 V respectively. At what frequency the current in the circuit lags the voltage by 45°. Give answer in ______ × 105 rad s-1.
When an alternating voltage of 220V is applied across device X, a current of 0.25A flows which lags behind the applied voltage in phase by π/2 radian. If the same voltage is applied across another device Y, the same current flows but now it is in phase with the applied voltage.
- Name the devices X and Y.
- Calculate the current flowing in the circuit when the same voltage is applied across the series combination of X and Y.
Which of the following combinations should be selected for better tuning of an L-C-R circuit used for communication?
A resistance of 200Ω and an inductor of \[\frac {1}{2π}\]Н are connected in series to a.c. voltage of 40 V and 100 Hz frequency. The phase angle between the voltage and current is ______.
Which law is applied around the loop to obtain the circuit equation?
