Advertisements
Advertisements
Question
Plot a graph showing the variation of photoelectric current, as a function of anode potential for two light beams having the same frequency but different intensities I1 and I2 (I1 > I2). Mention its important features.
Advertisements
Solution
We use radiations with varying frequencies but the same intensity. When the frequency increases, the photoelectric current increases, and when the frequency decreases, the photoelectric current decreases. However, beyond a particular anode potential, the photoelectric current remains constant for all radiations of different frequencies. This is referred to as saturation current. As a result, the saturation current is unaffected by radiation frequency.

APPEARS IN
RELATED QUESTIONS
It is found that photosynthesis starts in certain plants when exposed to sunlight, but it does not start if the plants are exposed only to infrared light. Explain.
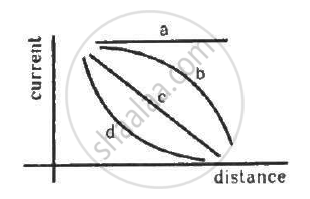
A point source causes photoelectric effect from a small metal plate. Which of the following curves may represent the saturation photocurrent as a function of the distance between the source and the metal?
A parallel beam of monochromatic light of wavelength 663 nm is incident on a totally reflecting plane mirror. The angle of incidence is 60° and the number of photons striking the mirror per second is 1.0 × 10¹⁹. Calculate the force exerted by the light beam on the mirror.
(Use h = 6.63 × 10⁻³⁴J-s = 4.14 × 10⁻¹⁵ eV-s, c = 3 × 10⁸ m/s and me = 9.1 × 10⁻³¹kg)
Show that it is not possible for a photon to be completely absorbed by a free electron.
Find the maximum kinetic energy of the photoelectrons ejected when light of wavelength 350 nm is incident on a cesium surface. Work function of cesium = 1.9 eV
(Use h = 6.63 × 10⁻³⁴J-s = 4.14 × 10⁻¹⁵ eV-s, c = 3 × 10⁸ m/s and me = 9.1 × 10⁻³¹kg)
The work function of a photoelectric material is 4.0 eV. (a) What is the threshold wavelength? (b) Find the wavelength of light for which the stopping potential is 2.5 V.
(Use h = 6.63 × 10⁻³⁴J-s = 4.14 × 10⁻¹⁵ eV-s, c = 3 × 10⁸ m/s and me = 9.1 × 10⁻³¹kg)
Find the maximum magnitude of the linear momentum of a photoelectron emitted when a wavelength of 400 nm falls on a metal with work function 2.5 eV.
(Use h = 6.63 × 10⁻³⁴J-s = 4.14 × 10⁻¹⁵ eV-s, c = 3 × 10⁸ m/s and me = 9.1 × 10⁻³¹kg)
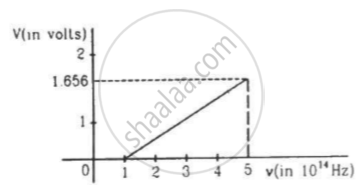
The figure is the plot of stopping potential versus the frequency of the light used in an experiment on photoelectric effect. Find (a) the ratio h/e and (b) the work function.
In photoelectric effect the photo current ______.
Consider a 20 W bulb emitting light of wavelength 5000 Å and shining on a metal surface kept at a distance 2 m. Assume that the metal surface has work function of 2 eV and that each atom on the metal surface can be treated as a circular disk of radius 1.5 Å.
- Estimate no. of photons emitted by the bulb per second. [Assume no other losses]
- Will there be photoelectric emission?
- How much time would be required by the atomic disk to receive energy equal to work function (2 eV)?
- How many photons would atomic disk receive within time duration calculated in (iii) above?
- Can you explain how photoelectric effect was observed instantaneously?
