Advertisements
Advertisements
Question
Plot a graph showing the variation of de Broglie wavelength (X) associated with a charged a particle of mass m, versus `1/sqrtV` where V is the potential difference through which the particle is accelerated. How does this graph give us information regarding the magnitude of the charge of the particle?
Advertisements
Solution
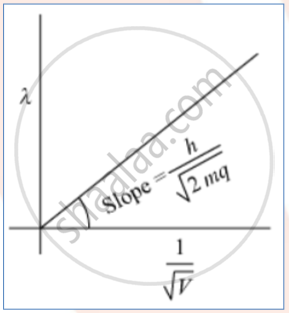
The slope of the graph is `h/sqrt(2mq)`considering we know the slope and mass of the charged particle we can easily calculate the charge.
APPEARS IN
RELATED QUESTIONS
Calculate the shortest wavelength of the spectral lines emitted in Balmer series.
[Given Rydberg constant, R = 107 m–1]
How does one explain, using de Broglie hypothesis, Bohr's second postulate of quantization of orbital angular momentum?
Show that the radius of the orbit in hydrogen atom varies as n2, where n is the principal quantum number of the atom.
Obtain an expression for the frequency of radiation emitted when a hydrogen atom de-excites from level n to level (n − 1). For large n, show that this frequency equals the classical frequency of revolution of the electron in the orbit.
Imagine removing one electron from He4 and He3. Their energy levels, as worked out on the basis of Bohr model will be very close. Explain why.
A particle of mass m is moving around the origin with a constant force F pulling it towards the origin. If Bohr model is used to describe its motion, the radius of the nth orbit and the particle’s speed v in the orbit depend on n as ______.
When can the magnitude of the electron’s momentum be written as \[mv_n\]?
What does de Broglie’s standing-wave argument explain about a hydrogen atom?
For which atoms does Bohr’s model correctly predict gross features?
With what does each electron in a multi-electron atom interact?
