Advertisements
Advertisements
प्रश्न
Plot a graph showing the variation of de Broglie wavelength (X) associated with a charged a particle of mass m, versus `1/sqrtV` where V is the potential difference through which the particle is accelerated. How does this graph give us information regarding the magnitude of the charge of the particle?
Advertisements
उत्तर
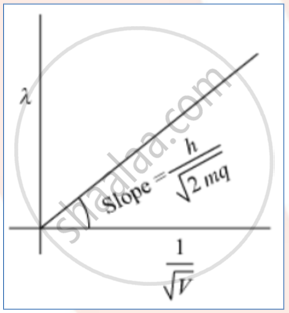
The slope of the graph is `h/sqrt(2mq)`considering we know the slope and mass of the charged particle we can easily calculate the charge.
APPEARS IN
संबंधित प्रश्न
How does one explain, using de Broglie hypothesis, Bohr's second postulate of quantization of orbital angular momentum?
Answer the following question.
State Bohr's quantization condition of angular momentum. Calculate the shortest wavelength of the Bracket series and state to which part of the electromagnetic spectrum it belongs.
Who explained the quantisation of the orbiting electron’s angular momentum in 1923?
What does the de Broglie hypothesis propose about material particles such as electrons?
Who experimentally verified the wave nature of electrons in 1927?
What does the condition \[2\pi r_n=n\lambda\] require of the orbit?
What does de Broglie’s standing-wave argument explain about a hydrogen atom?
For which atoms does Bohr’s model correctly predict gross features?
Which radiation frequencies does Bohr’s model predict especially well for hydrogenic atoms?
Which two-electron atom cannot be explained by extending Bohr’s model?
