Advertisements
Advertisements
Question
In a pictograph, if a symbol  represents 50 books in a library shelf, then the symbol
  represents 25 books.
Options
True
False
Advertisements
Solution
This statement is True.
Explanation:
If picture of 1 book represents 50 books in a library, then picture of `1/2` book will represent 25 books in a library.
APPEARS IN
RELATED QUESTIONS
The following pictograph shows different subject books which are kept in a school library.
| Subject | Number of books |
| Hindi |       |
| English |       |
| Math |      |
| Science |      |
| History |     |
Taking symbol of one book = 50 books, find:
Which books are maximum in number?
Representation of data by using pictures is known as ______________
A Pictograph is also known as _____________
The following table shows the weight of paddy cultivated in a particular village during the years 2010 to 2015
| Year | Paddy production |
| 2010 |  |
| 2011 |  |
| 2012 |  |
| 2013 |  |
| 2014 |  |
| 2015 |  |

Observe the pictograph and answer the following questions.
a) In which year paddy production was maximum?
b) In which year paddy production were equal?
c) Find the quantity of paddy production in 2015
d) Find the total quantity of paddy production particularly 2013, 2014, and 2015
Mr. Dinesh collected the information about the rainfall of a particular city in a week from the newspaper and recorded his information in the pictograph.
| Millimeters of Rain | |
| Sunday |  |
| Monday |  |
| Tuesday |  |
| Wednesday |  |
| Thursday |  |
| Friday |  |
| Saturday |  |
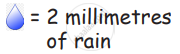
a. On which day, the rain was most?
b. On which day, the rain was least?
c. How much rain was there on Sunday?
d. How much rain was there on Monday?
e. Find total rainfall of the city in that week?
A ______ represents data through pictures of objects.
On the scale of 1 unit length = 10 crore, the bar of length 6 units will represent ______ crore and of ______ units will represent 75 crore.
The number of scouts in a school is depicted by the following pictograph:
| Class | Number of scouts  = 10 scouts = 10 scouts |
| VI |  |
| VII |  |
| VIII |  |
| IX |  |
| X |  |
Observe the pictograph and answer the following questions:
- Which class has the minimum number of scouts?
- Which class has the maximum number of scouts?
- How many scouts are there in Class VI?
- Which class has exactly four times the scouts as that of Class X?
- What is the total number of scouts in the Classes VI to X?
Annual expenditure of a company in the year 2007-2008 is given below:
| Items | Expenditure (Rs in lakh) |
| Salaries of employees | 65 |
| Advertisement | 10 |
| Purchase of machinery | 85 |
| Electricity and water | 15 |
| Transportation | 25 |
| Other expenses | 30 |
Prepare a pictograph of the above data using an appropriate symbol to represent Rs 10 lakh.
The following table shows the area of the land on which different crops were grown.
| Crop | Area of land (in million hectares) |
| Rice | 50 |
| Wheat | 30 |
| Pulses | 20 |
| Sugarcane | 25 |
| Cotton | 15 |
Prepare a pictograph by choosing a suitable symbol to represent 10 million hectares.
