Advertisements
Advertisements
Question
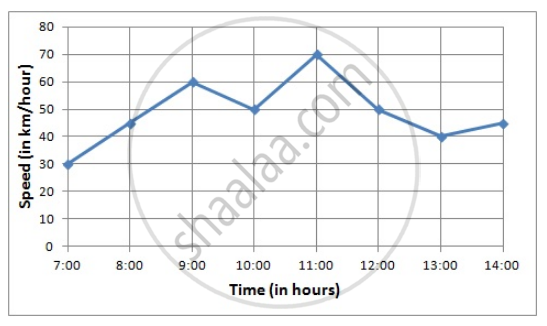
Draw the velocity-time graph from the following data:
| Time (in hours): | 7:00 | 8:00 | 9:00 | 10:00 | 11:00 | 12:00 | 13:00 | 14:00 |
| Speed (in km/hr): | 30 | 45 | 60 | 50 | 70 | 50 | 40 | 45 |
Advertisements
Solution
Here, time is an independent variable and speed is a dependent variable. So, we take time on the x-axis and speed on the y-axis.
Let us choose the following scale:
On x-axis: 2 big division = 1 hour
On y-axis: 1 big division = 10 km/hr
Let us assume that on the x-axis, the coordinate of origin (O) is 7:00.
So, the coordinates of O are (7:00,0).
Now, let us plot (7:00,30), (8:00,45), (9:00,60), (10:00,50), (11:00,70), (12:00,50), (13:00,40), (14:00,45). These points are joined to get the graph representing the given information as shown in the figure below.
APPEARS IN
RELATED QUESTIONS
Use the tables below to draw linear graphs.
The number of days a hill side city received snow in different years.
| Year | 2003 | 2004 | 2005 | 2006 |
| Days | 8 | 10 | 5 | 12 |
Can there be a time-temperature graph as follows? Justify your answer.

The following table shows the number of patients discharged from a hospital with HIV diagnosis in different years:
| Years: | 2002 | 2003 | 2004 | 2005 | 2006 |
| Number of patients: | 150 | 170 | 195 | 225 | 230 |
Represent this information by a graph.
Draw the temperature-time graph in each of the following cases:
| Time (in hours): | 7:00 | 9:00 | 11:00 | 13:00 | 15:00 | 17:00 | 19:00 | 21:00 |
| Temperature (°F) in: | 100 | 101 | 104 | 102 | 100 | 99 | 100 | 98 |
Draw the temperature-time graph in each of the following cases:
| Time (in hours): | 8:00 | 10:00 | 12:00 | 14:00 | 16:00 | 18:00 | 20:00 |
| Temperature (°F) in: | 100 | 101 | 104 | 103 | 99 | 98 | 100 |
Find out from the growth chart

- Will the plant keep growing all the time? What will be its length on the 100th day? Make a guess!
A line graph can also be a whole unbroken line.
Plot a line graph for the variables p and q where p is two times q i.e, the equation is p = 2q. Then find.
- the value of p when q = 3
- the value of q when p = 8
The following graph shows the change in temperature of a block of ice when heated. Use the graph to answer the following questions:
- For how many seconds did the ice block have no change in temperature?
- For how long was there a change in temperature?
- After how many seconds of heating did the temperature become constant at 0°C?
- What was the temperature after 25 seconds?
- What will be the temperature after 1.5 minutes? Justify your answer.

The following graph shows the number of people present at a certain shop at different times. Observe the graph and answer the following questions.

- What type of a graph is this?
- What information does the graph give?
- What is the busiest time of day at the shop?
- How many people enter the shop when it opens?
- About how many people are there in the shop at 1:30 pm?
