Advertisements
Advertisements
Question
Draw graphs showing variation of photoelectric current with applied voltage for two incident radiations of equal frequency and different intensities. Mark the graph for the radiation of higher intensity.
Advertisements
Solution

APPEARS IN
RELATED QUESTIONS
Every metal has a definite work function. Why do all photoelectrons not come out with the same energy if incident radiation is monochromatic? Why is there an energy distribution of photoelectrons?
Is it always true that for two sources of equal intensity, the number of photons emitted in a given time are equal?
What is the speed of a photon with respect to another photon if (a) the two photons are going in the same direction and (b) they are going in opposite directions?
It is found that photosynthesis starts in certain plants when exposed to sunlight, but it does not start if the plants are exposed only to infrared light. Explain.
The threshold wavelength of a metal is λ0. Light of wavelength slightly less than λ0 is incident on an insulated plate made of this metal. It is found that photoelectrons are emitted for some time and after that the emission stops. Explain.
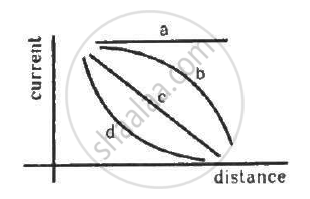
A point source causes photoelectric effect from a small metal plate. Which of the following curves may represent the saturation photocurrent as a function of the distance between the source and the metal?
Explain how does (i) photoelectric current and (ii) kinetic energy of the photoelectrons emitted in a photocell vary if the frequency of incident radiation is doubled, but keeping the intensity same?
Show the graphical variation in the above two cases.
Do all the electrons that absorb a photon come out as photoelectrons?
Consider a metal exposed to light of wavelength 600 nm. The maximum energy of the electron doubles when light of wavelength 400 nm is used. Find the work function in eV.
A metallic plate exposed to white light emits electrons. For which of the following colours of light, the stopping potential will be maximum?
