Advertisements
Advertisements
Question
Mr. Mirza’s monthly income is Rs. 7,200. He spends Rs. 1,800 on rent, Rs. 2,700 on food, Rs. 900 on the education of his children; Rs. 1,200 on Other things and saves the rest.
Draw a pie-chart to represent it.
Advertisements
Solution
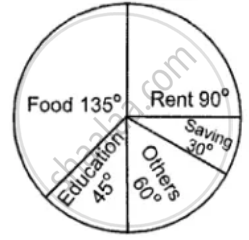
| Name of items | Expenditure/Saving in Rupees | Central angle |
| Rent | 1800 | `1800/7200 xx 360^circ = 90^circ` |
| food | 2700 | `2700/7200 xx 360^circ = 135^circ` |
| Education | 900 | `900/7200 xx 360^circ = 45^circ` |
| Others | 1200 | `1200/7200 xx 360^circ = 60^circ` |
| Saving | 600 | `600/7200 xx 360^circ = 30^circ` |
| Total | 7200 | `360^circ` |
APPEARS IN
RELATED QUESTIONS
Given below are the seats won by different political parties in the polling outcome of a state assembly elections:-
| Political Party | A | B | C | D | E | F |
| Seats Won | 75 | 55 | 37 | 29 | 10 | 37 |
- Draw a bar graph to represent the polling results.
- Which political party won the maximum number of seats?
The following table gives the distribution of students of two sections according to the mark obtained by them:-
| Section A | Section B | ||
| Marks | Frequency | Marks | Frequency |
| 0 - 10 | 3 | 0 - 10 | 5 |
| 10 - 20 | 9 | 10 - 20 | 19 |
| 20 - 30 | 17 | 20 - 30 | 15 |
| 30 - 40 | 12 | 30 - 40 | 10 |
| 40 - 50 | 9 | 40 - 50 | 1 |
Represent the marks of the students of both the sections on the same graph by two frequency polygons. From the two polygons compare the performance of the two sections.
Read the bar graph given in Fig. 23.19 and answer the following questions:
(i) What information is given by the bar graph?
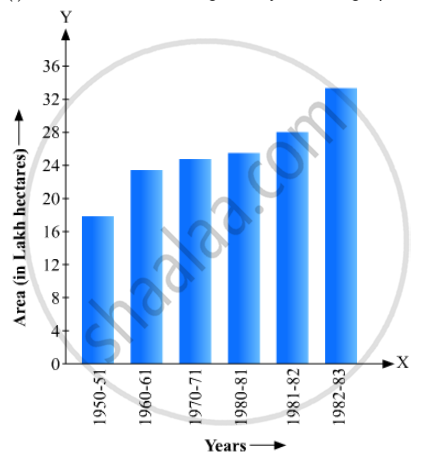
(ii) In which years the areas under the sugarcane crop were the maximum and the minimum?
(iii) State whether true or false:
The area under the sugarcane crop in the year 1982 - 83 is three times that of the year 1950 - 51
The following data gives the amount of manure (in thousand tonnes) manufactured by a company during some years:
| Year | 1992 | 1993 | 1994 | 1995 | 1996 | 1997 |
| Manure (in thousand tonnes) |
15 | 35 | 45 | 30 | 40 | 20 |
(i) Represent the above data with the help of a bar graph.
(ii) Indicate with the help of the bar graph the year in which the amount of manufactured by the company was maximum.
(iii) Choose the correct alternative:
The consecutive years during which there was maximum decrease in manure production are:
(a) 1994 and 1995
(b) 1992 and 1993
(c) 1996 and 1997
(d) 1995 and 1996
The investment (in ten crores of rupees) of Life Insurance Corporation of India in different sectors are given below:
| Sectors | Investment (in ten crores of rupees) |
| Central Government Securities State Government Securities Securities guaranteed by the Government Private Sectors Socially oriented sectors (Plans) Socially oriented sectors (Non-Plan) |
45 11 23 18 46 11 |
Represent the above data with the help of bar graph.
In a histogram the class intervals or the group are taken along
Students of a small school use different modes of travel to school as shown below:
| Mode | Bus | Car | Bicycle | Auto | On foot |
| No. of students | 142 | 98 | 50 | 34 | 16 |
Draw a suitable bar graph.
The following table gives the frequencies of most commonly used letters a, e, i, o, r, t, u from a page of a book:
| Letters | a | e | i | o | r | t | u |
| Frequency | 75 | 125 | 80 | 70 | 80 | 95 | 75 |
Represent the information above by a bar graph.
The marks obtained (out of 100) by a class of 80 students are given below:
| Marks | Number of students |
| 10 – 20 | 6 |
| 20 – 30 | 17 |
| 30 – 50 | 15 |
| 50 – 70 | 16 |
| 70 – 100 | 26 |
Construct a histogram to represent the data above.
Following table gives the distribution of students of sections A and B of a class according to the marks obtained by them.
| Section A | Section B | ||
| Marks | Frequency | Marks | Frequency |
| 0 – 15 | 5 | 0 – 15 | 3 |
| 15 – 30 | 12 | 15 – 30 | 16 |
| 30 – 45 | 28 | 30 – 45 | 25 |
| 45 – 60 | 30 | 45 – 60 | 27 |
| 60 –75 | 35 | 60 – 75 | 40 |
| 75 – 90 | 13 | 75 – 90 | 10 |
Represent the marks of the students of both the sections on the same graph by two frequency polygons. What do you observe?
