Advertisements
Advertisements
प्रश्न
The velocity-time graph (Fig. 8.5) shows the motion of a cyclist. Find (i) its acceleration (ii) its velocity and (iii) the distance covered by the cyclist in 15 seconds.

Advertisements
उत्तर
Velocity-time graph is a straight line parallel to the time axis, so, the velocity of the cyclist is constant.
(i) Acceleration = 0
(ii) At, f = 15 s velocity = 20 m s’1 (from the given graph)
(iii) Distance covered by the cyclist in 15 s
= Area under v - t graph during that time interval
= 20 ms’1 x 15 s
= 300 m.
APPEARS IN
संबंधित प्रश्न
Name the physical quantity whose SI unit is :
(a) m/s (b) m/s2
Find the initial velocity of a car which is stopped in 10 seconds by applying brakes. The retardation due to brakes is 2.5 m/s2.
The slope of a speed-time graph gives:
Define velocity. State its unit.
A body starts from rest and acquires a velocity 10 m s-1 in 2 s. Find the acceleration.
Multiple choice Question. Select the correct option.
A body dropped from the top of a tower reaches the ground in 4s. Height of the tower is
Multiple choice Question. Select the correct option.
At the maximum height, a body thrown vertically upwards has :
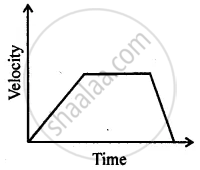
Can you suggest a real-life example about the motion of a body from the following velocity – time graph?
A body is thrown vertically upward with velocity u, the greatest height h to which it will rise is,
An electron moving with a velocity of 5 × 10⁴ ms−1 enters into a uniform electric field and acquires a uniform acceleration of 104 ms–2 in the direction of its initial motion.
(i) Calculate the time in which the electron would acquire a velocity double of its initial velocity.
(ii) How much distance the electron would cover at this time?
