Advertisements
Advertisements
प्रश्न
The following table gives the distribution of IQ's (intelligence quotients) of 60 pupils of class V in a school:
| IQ's: | 125.5 to 13.25 |
118.5 to 125.5 |
111.5 to 118.5 |
104.5 to 111.5 |
97.5 to 104.5 |
90.5 to 97.5 |
83.5 to 90.5 |
76.5 to 83.5 |
69.5 to 76.5 |
62.5 to 69.5 |
| No. of pupils: |
1 | 3 | 4 | 6 | 10 | 12 | 15 | 5 | 3 | 1 |
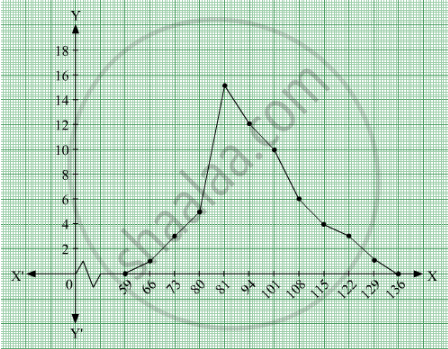
Draw a frequency polygon for the above data.
Advertisements
उत्तर १
We first draw horizontal and vertical axes. Let us consider that the horizontal and vertical axes represent the class-limits and the frequencies of the class-intervals respectively.
The given data is a continuous grouped frequency distribution with equal class-intervals. To draw the frequency polygon of the given data without using histogram, obtain the class-limits of the class intervals. Obtain the class-limits of two class-intervals of 0 frequencies, i.e. on the horizontal axis, one adjacent to the first, on its left and one adjacent to the last, on its right. These class-intervals are known as imagined class-intervals. Then plot the frequencies against class-limits.
The following table is useful to draw the frequency polygon of the given data.
| Class - Intervals | Class - Marks | Frequency |
| 55.5-62.5 | 59 | 0 |
| 62.5-69.5 | ||
We represent class marks on X-axis on a suitable scale and the frequencies on Y-axis on a suitable scale.
To obtain the frequency polygon we plot the points (66, 1), (73, 3), (80, 5), (87, 15), (94, 12), (101, 10), (108, 6), (115, 4), (122, 3), (129, 1).
Now we join the plotted points by line segments. The end points (66, 1) and (129, 1) are joined to the mid points (59, 0) and ( 136, 0) respectively of imagined class intervals to obtain the frequency polygon.
उत्तर २
We first draw horizontal and vertical axes. Let us consider that the horizontal and vertical axes represent the class-limits and the frequencies of the class-intervals respectively.
The given data is a continuous grouped frequency distribution with equal class-intervals. To draw the frequency polygon of the given data without using histogram, obtain the class-limits of the class intervals. Obtain the class-limits of two class-intervals of 0 frequencies, i.e. on the horizontal axis, one adjacent to the first, on its left and one adjacent to the last, on its right. These class-intervals are known as imagined class-intervals. Then plot the frequencies against class-limits.
The following table is useful to draw the frequency polygon of the given data.
| Class - Intervals | Class - Marks | Frequency |
| 55.5-62.5 | 59 | 0 |
| 62.5-69.5 | 66 | 1 |
| 69.5 - 76.5 | 73 | 3 |
| 76.5 - 83.5 | 80 | 5 |
| 83.5 - 90.5 | 87 | 15 |
| 90.5 - 97.5 | 94 | 12 |
| 97.5-104.5 | 101 | 10 |
| 104-111.5 | 108 | 6 |
| 111.5 - 118.5 | 115 | 4 |
| 118.5-125.5 | 122 | 3 |
| 125.5-132.5 | 129 | 1 |
| 132.5-139.5 | 136 | 0 |
We represent class marks on X-axis on a suitable scale and the frequencies on Y-axis on a suitable scale.
To obtain the frequency polygon we plot the points (66, 1), (73, 3), (80, 5), (87, 15), (94, 12), (101, 10), (108, 6), (115, 4), (122, 3), (129, 1).
Now we join the plotted points by line segments. The end points (66, 1) and (129, 1) are joined to the mid points (59, 0) and ( 136, 0) respectively of imagined class intervals to obtain the frequency polygon.
APPEARS IN
संबंधित प्रश्न
The following table gives the distribution of students of two sections according to the mark obtained by them:-
| Section A | Section B | ||
| Marks | Frequency | Marks | Frequency |
| 0 - 10 | 3 | 0 - 10 | 5 |
| 10 - 20 | 9 | 10 - 20 | 19 |
| 20 - 30 | 17 | 20 - 30 | 15 |
| 30 - 40 | 12 | 30 - 40 | 10 |
| 40 - 50 | 9 | 40 - 50 | 1 |
Represent the marks of the students of both the sections on the same graph by two frequency polygons. From the two polygons compare the performance of the two sections.
Read the bar graph shown in Fig. 23.8 and answer the following questions:

(i) What is the information given by the bar graph?
(ii) How many tickets of Assam State Lottery were sold by the agent?
(iii) Of which state, were the maximum number of tickets sold?
(iv) State whether true or false.
The maximum number of tickets sold is three times the minimum number of tickets sold.
(v) Of which state were the minimum number of tickets sold?
The following data gives the number (in thousands) of applicants registered with an
| Year | 1995 | 1996 | 1997 | 1998 | 1999 | 2000 |
| Number of applicants registered (in thousands) | 18 | 20 | 24 | 28 | 30 | 34 |
Construct a bar graph to represent the above data.

The following table gives the route length (in thousand kilometres) of the Indian Railways in some of the years:
| Year | 1960-61 | 1970-71 | 1980-81 | 1990-91 | 2000-2001 |
| Route length (in thousand km) |
56 | 60 | 61 | 74 | 98 |
Represent the above data with the help of a bar graph.
The following data gives the amount of loans (in crores of rupees) disbursed by a bank during some years:
| Year | 1992 | 1993 | 1994 | 1995 | 1996 |
| Loan (in crores of rupees) |
28 | 33 | 55 | 55 | 80 |
(i) Represent the above data with the help of a bar graph.
(ii) With the help of the bar graph, indicate the year in which amount of loan is not increased over that of the preceding year.
The following data gives the amount of manure (in thousand tonnes) manufactured by a company during some years:
| Year | 1992 | 1993 | 1994 | 1995 | 1996 | 1997 |
| Manure (in thousand tonnes) |
15 | 35 | 45 | 30 | 40 | 20 |
(i) Represent the above data with the help of a bar graph.
(ii) Indicate with the help of the bar graph the year in which the amount of manufactured by the company was maximum.
(iii) Choose the correct alternative:
The consecutive years during which there was maximum decrease in manure production are:
(a) 1994 and 1995
(b) 1992 and 1993
(c) 1996 and 1997
(d) 1995 and 1996
In a frequency distribution, ogives are graphical representation of
A histogram is a pictorial representation of the grouped data in which class intervals and frequency are respectively taken along
The daily wages in a factory are distributed as follows:
|
Daily wages (in Rs.) |
125 - 175 |
175 - 225 |
225 - 275 |
275 - 325 |
325 - 375 |
|
Number of workers |
4 |
20 |
22 |
10 |
6 |
Draw a frequency polygon for this distribution.
The number of students (boys and girls) of class IX participating in different activities during their annual day function is given below:
| Activities | Dance | Speech | Singing | Quiz | Drama | Anchoring |
| Boys | 12 | 5 | 4 | 4 | 10 | 2 |
| Girls | 10 | 8 | 6 | 3 | 9 | 1 |
Draw a double bar graph for the above data.
