Advertisements
Advertisements
प्रश्न
Match the coordinates given in Column A with the items mentioned in Column B.
| Column A | Column B |
| (1) (0, 5) | (a) y coordinate is 2 × x - coordinate + 1. |
| (2) (2, 3) | (b) Coordinates of origin. |
| (3) (4, 8) | (c) Only y–coordinate is zero. |
| (4) (3, 7) | (d) The distance from x-axis is 5. |
| (5) (0, 0) | (e) y coordinate is double of x-coordinate. |
| (6) (5, 0) | (f) The distance from y-axis is 2. |
Advertisements
उत्तर
| Column A | Column B |
| (1) (0, 5) | (d) The distance from x-axis is 5. |
| (2) (2, 3) | (f) The distance from y-axis is 2. |
| (3) (4, 8) | (e) y coordinate is double of x –coordinate. |
| (4) (3, 7) | (a) y coordinate is 2 × x - coordinate + 1. |
| (5) (0, 0) | (b) Coordinates of origin. |
| (6) (5, 0) | (c) Only y–coordinate is zero. |
Explanation:
(1) In the pair (0, 5), the second number also known as ordinate represents the distance from x-axis, i.e. 5.
(2) In the pair (2, 3), 2 the first number, also known as abscissa represents the distance from y-axis that is 2.
(3) We have the coordinates (4, 8). Clearly, coordinate is double of x-coordinate.
(4) We have the coordinate (3, 7), where x-coordinate = 3 and y-coordinate = 7
Evidently, y-coordinate = 2 × x-coordinate + 1
(5) (0, 0) are the coordinates of origin.
(6) In the point (5, 0), the y-coordinate is zero.
APPEARS IN
संबंधित प्रश्न
Locate the points:
(2, 1), (2, 2), (2, 3), (2, 4)
Locate the points:
(1, 3), (2, 3), (3, 3), (4, 3)
The following table shows the amount of rice grown by a farmer in different years:
| Years: | 2000 | 2001 | 2002 | 2003 | 2004 | 2005 | 2006 |
| Rice grown (in quintals): | 200 | 180 | 240 | 260 | 250 | 200 | 270 |
Plot a graph to illustrate this information.
We need ______ coordinates for representing a point on the graph sheet.
A point in which the x-coordinate is zero and y-coordinate is non-zero will lie on the ______.
In the point (4, 7), 4 denotes the ______.
The points (3, 5) and (5, 3) represent the same point.
Write the y-coordinate (ordinate) of the given point.
(4, 0)
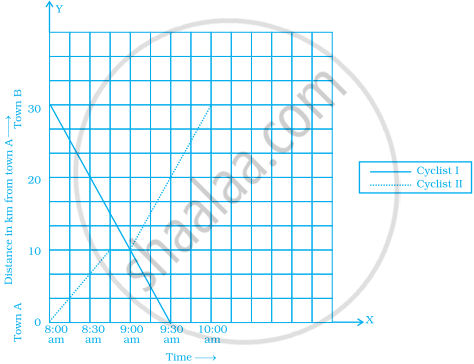
The following graph shows the journey made by two cyclists, one from town A to B and the other from town B to A.
- At what time did cyclist II rest? How long did the cyclist rest?
- Was cyclist II cycling faster or slower after the rest?
- At what time did the two cyclists meet?
- How far had cyclist II travelled when he met cyclist I?
- When cyclist II reached town A, how far was cyclist I from town B?
The graph given below compares the price (in Rs) and weight of 6 bags (in kg) of sugar of different brands A, B, C, D, E, F.
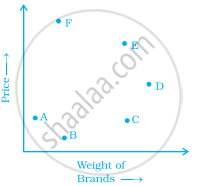
- Which brand(s) costs/cost more than Brand D?
- Bag of which brand of sugar is the heaviest?
- Which brands weigh the same?
- Which brands are heavier than brand B?
- Which bag is the lightest?
- Which bags are of the same price?
