Advertisements
Advertisements
प्रश्न
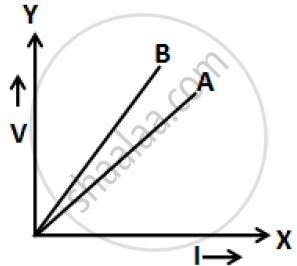
Draw a V-I graph for a conductor at two different temperatures. What conclusion do you draw from your graph for the variation of resistance of conductor with temperature?
Advertisements
उत्तर

In the above graph, T1 > T2. The straight line A is steeper than line B, which leads us to conclude that the resistance of a the conductor is more at high-temperature T1 than at low-temperature T2. Thus, we can say that the resistance of a conductor increases with an increase in temperature.
APPEARS IN
संबंधित प्रश्न
The V-I graph for a series combination and for a parallel combination of two resistors is shown in the figure below. Which of the two A or B. represents the parallel combination? Give reasons for your answer.
Calculate the resistance of an aluminium cable of length 10 km and diameter 2.0 mm if the resistivity of aluminium is 27 × 10−8 Ωm.
State how are the two resistors joined with a battery when equivalent resistance is more than either of the two resistances.
How will you oonnect five resistors, each of the value one ohm, to obtain an equivalent resistance of 0.2 `Omega`
You have three resistors of values 2 `Omega`, 3 `Omega`, and 5 `Omega`. How will you join them so that the total resistance is less than 2 `Omega`?
A given metallic wire of resistance R is doubled on itself. What will be its new resistance?
State expression for Cells connected in parallel.
State a relation between electrical power, resistance and potential difference in an electrical circuit.
Illustrate-combination of cells e.g., three cells, in parallel, explaining the combination briefly. Obtain an expression for current ‘i’ in the combination.
