Advertisements
Advertisements
प्रश्न
Draw a V-I graph for a conductor at two different temperatures. What conclusion do you draw from your graph for the variation of resistance of conductor with temperature?
Advertisements
उत्तर

In the above graph, T1 > T2. The straight line A is steeper than line B, which leads us to conclude that the resistance of a the conductor is more at high-temperature T1 than at low-temperature T2. Thus, we can say that the resistance of a conductor increases with an increase in temperature.
APPEARS IN
संबंधित प्रश्न
A battery of 9 V is connected in series with resistors of 0.2 Ω, 0.3 Ω, 0.4 Ω, 0.5 Ω and 12 Ω, respectively. How much current would flow through the 12 Ω resistor?
Why is the series arrangement not used for domestic circuits?
Two resistors of 4Ω and 6 Ω are connected in parallel to a cell to draw 0.5 A current from the cell.
(i) Draw a labelled circuit diagram showing the above arrangement.
(ii) Calculate the current in each resistor. What is an Ohmic resistor?
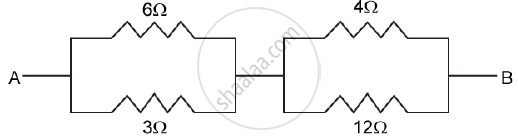
Find the equivalent resistance between A and B
A p.d. of 4 V is applied to two resistors of 6 Ω and 2 Ω connected in series. Calculate:
(a) the combined resistance
(b) the current flowing
(c) the p.d. across the 6 Ω resistor
If two resistors of 25 Ω and 15 Ω are joined together in series and then placed in parallel with a 40 Ω resistor, the effective resistance of the combination is :
(a) 0.1 Ω
(b) 10 Ω
(c) 20 Ω
(d)40 Ω
State expression for Resistance connected in parallel.
2Ω resistor A, 1Ω resistor B and 4Ω resistor C are connected in parallel. The combination is connected across a 2V battery of negligible resistance. Draw the diagram of the arrangement and calculate:
(i) The current in each resistor A and C,
(ii) The current through battery.
Two electric bulbs have resistances in the ratio 1 : 2. If they are joined in series, the energy consumed in them is in the ratio:
