Advertisements
Advertisements
Question
What is the source of winter rainfall in Tamil Nadu?
Advertisements
Solution
North-east winter monsoon wind or retreating monsoon.
RELATED QUESTIONS
Name an area in India where Tropical Monsoon forest is found.
Give a reason for each of the following:
The Summer Monsoon winds blow over the Arabian Sea from the South West.
Name the following: The local wind that brings a light rainfall to South India and is good for tea and
coffee crops.
Give geographical reasons for each of the following
Kanpur has extreme temperature conditions.
Mention the geographical reasons for the following:
Patna receives heavier rain than Delhi.
Mention the geographical reason for the following:
Western Rajasthan receives no rain from the Arabian Sea branch of the South West Monsoon winds.
Study the data of distribution of temperature and rain for Station X and answer the questions that follow :
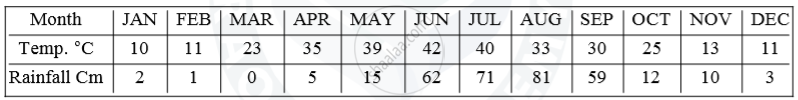
(i) Is Station X in the coastal area or in the interior of the country?
(ii) Calculate the total annual rainfall for Station X.
(iii) Name the wind that brings most of the rainfall to Station X.
India is known as the land of the endless growing Season. Explain.
Rajasthan receives very little rainfall.
Now find out
Why is July rainier in Mumbai than in Thiruvananthapuram?
