Advertisements
Advertisements
Question
Try yourself
On any one day, choose any three cities and record their temperature from the TV or newspaper.
- Make a bar chart in your notebook and ask your friends a few questions about it. See if they understand your chart!
Advertisements
Solution
Let us show the highest temperature (in degrees Celsius) in three cities: Delhi, Bangalore, and Sikkim.

APPEARS IN
RELATED QUESTIONS
Read the bar graph (see the given figure) which shows the number of books sold by a bookstore during five consecutive years and answer the questions that follow:

- About how many books were sold in 1989? 1990? 1992?
- In which year were about 475 books sold? About 225 books sold?
- In which years were fewer than 250 books sold?
- Can you explain how you would estimate the number of books sold in 1989?
Practice time: Afterschool
Ask 10 of your friends about what they like to do most after school.
| What they like to do after school |
Number of children |
| Watching TV | |
| Playing football | |
| Reading storybooks | |
In a bar graph, the width of bars may be unequal.
In a bar graph, each bar (rectangle) represents only one value of the numerical data.
The following bar graph shows the number of houses (out of 100) in a town using different types of fuels for cooking.
Read the bar graph and answer the following questions:
Scale: 1 unit length = 5 houses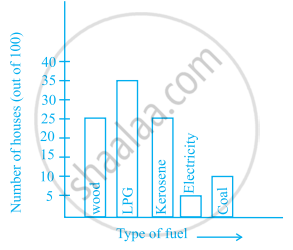
- Which fuel is used in maximum number of houses?
- How many houses are using coal as fuel?
- Suppose that the total number of houses in the town is 1 lakh.
From the above graph estimate the number of houses using electricity.
Study the double bar graphs given below and answer the following questions:

- Which sport is liked the most by Class VIII students?
- How many students of Class VII like Hockey and Tennis in all?
- How many students are there in Class VII?
- For which sport is the number of students of Class VII less than that of Class VIII?
- For how many sports students of Class VIII are less than Class VII?
- Find the ratio of students who like Badminton in Class VII to students who like Tennis in Class VIII.
Observe the given data:
| Days of the week |
Mon | Tues | Wed | Thurs | Fri | Sat |
| Number of Mobile Phone Sets Sold |
50 | 45 | 30 | 55 | 27 | 60 |
- Draw a bar graph to represent the above given information.
- On which day of the week was the sales maximum?
- Find the total sales during the week.
- Find the ratio of the minimum sale to the maximum sale.
- Calculate the average sale during the week.
- On how many days of the week was the sale above the average sales?
The marks out of 100 obtained by Kunal and Soni in the Half Yearly Examination are given below:
| Subjects | English | Hindi | Maths | Science | S. Science | Sanskirt |
| Kunal | 72 | 81 | 92 | 96 | 64 | 85 |
| Soni | 86 | 89 | 90 | 82 | 75 | 82 |
- Draw a double bar graph by choosing appropriate scale.
- Calculate the total percentage of marks obtained by Soni.
- Calculate the total percentage of marks obtained by Kunal.
- Compare the percentages of marks obtained by Kunal and Soni.
- In how many subjects did Soni get more marks than Kunal? Which are those subjects?
- Who got more marks in S. Science and what was the difference of marks?
- In which subject the difference of marks was maximum and by how much?
The data given below shows the production of motorbikes in a factory for some months of two consecutive years.
| Months | Feb | May | August | October | December |
| 2008 | 2700 | 3200 | 6000 | 5000 | 4200 |
| 2007 | 2800 | 4500 | 4800 | 4800 | 5200 |
Study the table given above and answer the following questions:
- Draw a double bar graph using appropriate scale to depict the above information and compare them.
- In which year was the total output the maximum?
- Find the mean production for the year 2007.
- For which month was the difference between the production for the two years the maximum?
- In which month for the year 2008, the production was the maximum?
- In which month for the year 2007, the production was the least?
The table below gives the data of tourists visiting 5 hill stations over two consecutive years. Study the table and answer the questions that follow:
| Hill stations | Nainital | Shimla | Manali | Mussoorie | Kullu |
| 2008 | 4000 | 5200 | 3700 | 5800 | 3500 |
| 2009 | 4800 | 4500 | 4200 | 6200 | 4600 |
- Draw a double bar graph to depict the above information using appropriate scale.
- Which hill station was visited by the maximum number of tourists in 2008?
- Which hill station was visited by the least number of tourists in 2009?
- In which hill stations was there increase in number of tourists in the year 2009?
