Advertisements
Advertisements
Question
|
Attendance Board Date 8/2/2007 |
|||
| Class | Number of Students | Students Present | Students absent |
| Class I | 27 | 25 | 2 |
| Class II | 23 | 22 | 1 |
| Class III | 24 | 21 | 3 |
| Class IV | 22 | 18 | 4 |
| Class V | 25 | 23 | 2 |
| Total | |||
This board shows the number of students in each class. It also shows the number of students present and absent.
How many children in all are absent on that day?
Advertisements
Solution
|
Attendance Board Date 8/2/2007 |
|||
| Class | Number of Students | Students Present | Students absent |
| Class I | 27 | 25 | 2 |
| Class II | 23 | 22 | 1 |
| Class III | 24 | 21 | 3 |
| Class IV | 22 | 18 | 4 |
| Class V | 25 | 23 | 2 |
| Total | 121 | 109 | 12 |
There are 12 students who did not come to school that day.
APPEARS IN
RELATED QUESTIONS
Note the time you spend in front of a TV or radio every day. Do this for one week.
The time spent in a week is ______ hours.
Read the poem carefully and answer these questions.
- Which word comes most often in the poem?
- Which letter has been used most?
- Which letter comes the least?
Use a scale and find out from your chart:
- The length of the longest strip is ______ cm.
- So, ______ has the biggest head.
- The smallest strip is ______ cm long. It belongs to ______
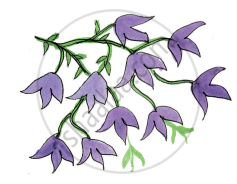
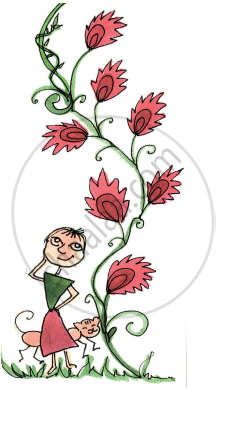
What coloured flowers did you see?
 |
 |
 |
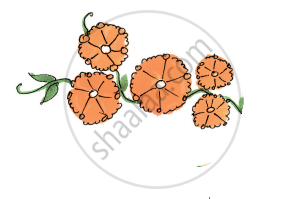 |
Look at the different flowers in the picture. Complete the table:
| Colour of flowers | Number of flowers |
| Blue | |
| Red | |
| Orange | |
| Purple |
| Colour of flowers | Number of flowers |
| Blue | 9 |
| Red | 7 |
| Orange | 5 |
| Purple | 10 |
Draw the right flower. Write how many there are.
 |
 |
 |
 |
______ are more than ______
| Face of the die | Number of times ( / for each throw) |
 |
| | | | | |
 |
| | | |
 |
| | | | | |
 |
| | | | |
 |
| | | | | | | |
 |
| | | | | | |
How many times did come up? ______ times
| Favourite sweet | Number of people |
| Jalebi | 20 |
| Rasgulla | 18 |
| Jamun | 25 |
| Laddoo | 22 |
| Burfi | 17 |
| Kalakand | 15 |
| Absent Students' Chart | |
| Class | Absent student |
| Class I |   |
| Class II |  |
| Class III |    |
| Class IV |     |
| Class V | |
This is a chart to show the number of absent students. Each absent student is shown by  .
.
In the chart show the absent students of Class V.
Rohan, Jacob and Geeta also measured their hands. They stuck their strips as shown.

Look at the picture and fill in the blanks:
______ has the longest hand.
