Advertisements
Advertisements
प्रश्न
|
Attendance Board Date 8/2/2007 |
|||
| Class | Number of Students | Students Present | Students absent |
| Class I | 27 | 25 | 2 |
| Class II | 23 | 22 | 1 |
| Class III | 24 | 21 | 3 |
| Class IV | 22 | 18 | 4 |
| Class V | 25 | 23 | 2 |
| Total | |||
This board shows the number of students in each class. It also shows the number of students present and absent.
How many children in all are absent on that day?
Advertisements
उत्तर
|
Attendance Board Date 8/2/2007 |
|||
| Class | Number of Students | Students Present | Students absent |
| Class I | 27 | 25 | 2 |
| Class II | 23 | 22 | 1 |
| Class III | 24 | 21 | 3 |
| Class IV | 22 | 18 | 4 |
| Class V | 25 | 23 | 2 |
| Total | 121 | 109 | 12 |
There are 12 students who did not come to school that day.
APPEARS IN
संबंधित प्रश्न
Watching TV/listening to the radio…
- ______ children spend more than 6 hours in a week.
- ______ children spend no time at all.
- Most children spend ______ hours in a week.
- ______ children spend more than 3 hours.
Take a paragraph you like from your language textbook. Read carefully and find out.
- Which word comes most often? How many times?
- Which word comes least often?
- The letter used most often is ______
- The letter used least often is ______
 |
 |
 |
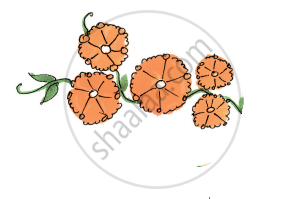 |
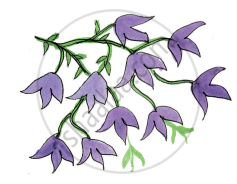
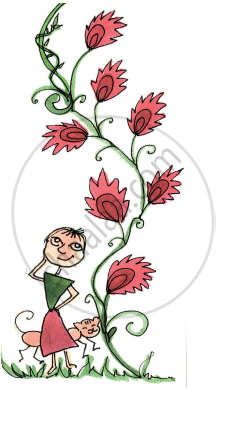
Look at the different flowers in the picture. Complete the table:
| Colour of flowers | Number of flowers |
| Blue | |
| Red | |
| Orange | |
| Purple |
Answer the following question.
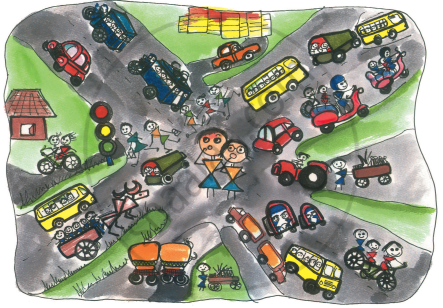
Answer the following question.
Which way of travel (vehicle) do you see the least?
Answer the following question.

The number of people walking is more than the number of ______.
Answer the following question.

The number of buses is less than the number of ______.
Talk to people around you about their favourite sweets. Fill in the table:
| Favourite sweet | Number of people |
| Jalebi | |
| Favourite sweet | Number of people |
| Jalebi | 20 |
| Rasgulla | 18 |
| Jamun | 25 |
| Laddoo | 22 |
| Burfi | 17 |
| Kalakand | 15 |
What have your classmates brought for lunch today? Find out and note down.
| Food item | Number of students |
Which vegetable is most disliked? Ask your friends and complete the table.
| Vegetable disliked | Number of students |
