Advertisements
Advertisements
Question
Match the following graphs of ideal gas with their co-ordinates:
| Graphical representation | x and y co-ordinates |
(i) 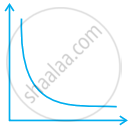 |
(a) pV vs. V |
(ii) 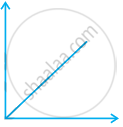 |
(b) p vs. V |
(iii) 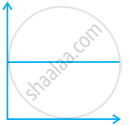 |
(c) p vs. `1/V` |
Advertisements
Solution
| Graphical representation | x and y co-ordinates |
| (i) |
(b) p vs. V |
| (ii) |
(c) p vs. `1/V` |
| (iii) |
(a) pV vs. V |
APPEARS IN
RELATED QUESTIONS
Compressibility factor for CO2 at 400 K and 71.0 bar is 0.8697. The molar volume of CO2 under these conditions is
Maximum deviation from ideal gas is expected from
Which of the following diagrams correctly describes the behaviour of a fixed mass of an ideal gas? (T is measured in K)
Suppose there is a tiny sticky area on the wall of a container of gas. Molecules hitting this area stick there permanently. Is the pressure greater or less than on the ordinary area of walls?
Explain whether a gas approaches ideal behavior or deviates from ideal behaviour if the temperature is raised while keeping the volume constant.
Explain whether a gas approaches ideal behavior or deviates from ideal behaviour if more gas is introduced into the same volume and at the same temperature.
Write the Van der Waals equation for a real gas. Explain the correction term for pressure and volume.
A plot of volume (V) versus temperature (T) for a gas at constant pressure is a straight line passing through the origin. The plots at different values of pressure are shown in Figure. Which of the following order of pressure is correct for this gas?
Under which of the following two conditions applied together, a gas deviates most from the ideal behaviour?
(i) Low pressure
(ii) High pressure
(iii) Low temperature
(iv) High temperature
If 1 gram of each of the following gases are taken at STP, which of the gases will occupy (a) greatest volume and (b) smallest volume?
\[\ce{CO, H2O, CH4 , NO}\]
Value of universal gas constant (R) is same for all gases. What is its physical significance?
Compressibility factor, Z, of a gas is given as Z = `(pV)/(nRT)`. For real gas what will be the effect on value of Z above Boyle’s temperature?
Pressure versus volume graph for a real gas and an ideal gas are shown in figure. Answer the following questions on the basis of this graph.
(i) Interpret the behaviour of real gas with respect to ideal gas at low pressure.
(ii) Interpret the behaviour of real gas with respect to ideal gas at high pressure.
(iii) Mark the pressure and volume by drawing a line at the point where real gas behaves as an ideal gas.
Isotherms of carbon dioxide gas are shown in figure. Mark a path for changing gas into liquid such that only one phase (i.e., either a gas or a liquid) exists at any time during the change. Explain how the temperature, volume and pressure should be changed to carry out the change.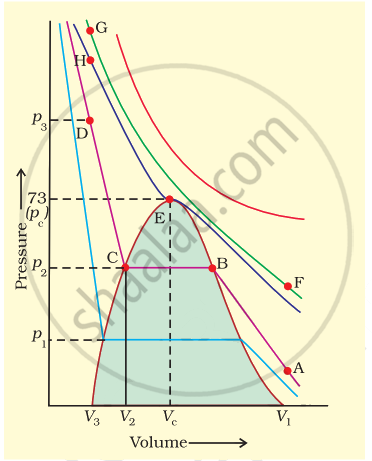
Choose the correct option for the total pressure (in atm.) in a mixture of 4g \[\ce{O2}\] and 2g \[\ce{H2}\] confined in a total volume of one litre at 0°C is ______.
[Given R = 0.082 L atm mol−1K−1, T = 273 K]
