Advertisements
Advertisements
Question
Maximum deviation from ideal gas is expected from
Options
\[\ce{CH4_{(g)}}\]
\[\ce{NH3_{(g)}}\]
\[\ce{H2_{(g)}}\]
\[\ce{N2_{(g)}}\]
Advertisements
Solution
\[\ce{NH3_{(g)}}\]
APPEARS IN
RELATED QUESTIONS
Which of the following is the correct expression for the equation of state of van der Waals gas?
Compressibility factor for CO2 at 400 K and 71.0 bar is 0.8697. The molar volume of CO2 under these conditions is
In what way real gases differ from ideal gases.
Explain whether a gas approaches ideal behavior or deviates from ideal behaviour if the temperature is raised while keeping the volume constant.
Explain whether a gas approaches ideal behavior or deviates from ideal behaviour if more gas is introduced into the same volume and at the same temperature.
Which of the following gases would you expect to deviate from ideal behavior under conditions of low-temperature F2, Cl2, or Br2? Explain.
Write the Van der Waals equation for a real gas. Explain the correction term for pressure and volume.
A plot of volume (V) versus temperature (T) for a gas at constant pressure is a straight line passing through the origin. The plots at different values of pressure are shown in Figure. Which of the following order of pressure is correct for this gas?
Match the following graphs of ideal gas with their co-ordinates:
| Graphical representation | x and y co-ordinates |
(i) 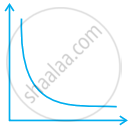 |
(a) pV vs. V |
(ii) 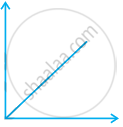 |
(b) p vs. V |
(iii) 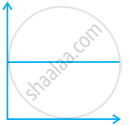 |
(c) p vs. `1/V` |
In van der Waal's equation for the real gas, the expression for the net force of attraction amongst the gas molecules is given by:
