Advertisements
Advertisements
Question
For following distribution, draw a histogram:
| Class | 1 – 10 | 11 – 20 | 21 – 30 | 31 – 40 | 41 – 50 | 51 – 60 |
| Frequency | 7 | 3 | 5 | 2 | 6 | 4 |
Graph
Advertisements
Solution
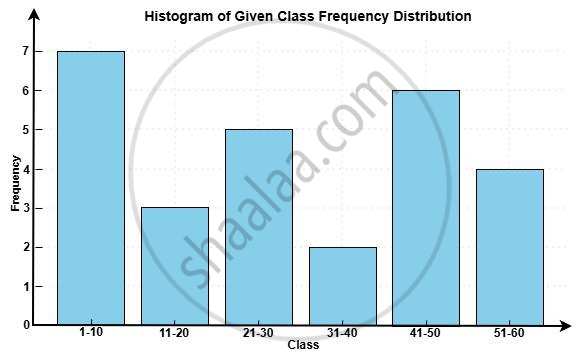
Here’s the histogram representing the given class frequency distribution. Each bar shows the number of observations (frequency) for the corresponding class interval.
shaalaa.com
Is there an error in this question or solution?
