Advertisements
Advertisements
Question
Draw a histogram for the following distribution:
| Money earned (in ₹) | 0 – 20 | 20 – 40 | 40 – 60 | 60 – 80 | 80 – 100 | 100 –120 | 120 –140 |
| No. of students | 4 | 18 | 22 | 14 | 10 | 8 | 4 |
Graph
Advertisements
Solution
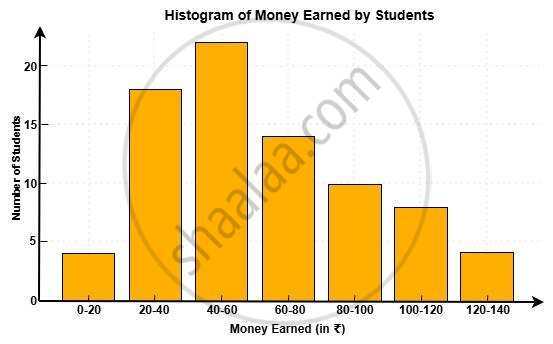
Here is the histogram representing the distribution of money earned by students. Each bar shows the number of students corresponding to each income range.
shaalaa.com
Is there an error in this question or solution?
