Advertisements
Advertisements
Question
Draw a histogram for daily earnings of 20 drug stores given in the following data:
| Daily earnings: (in ₹) | 150 – 200 | 200 – 250 | 250 – 300 | 300 – 350 |
| Number of stores | 14 | 9 | 3 | 4 |
Graph
Advertisements
Solution
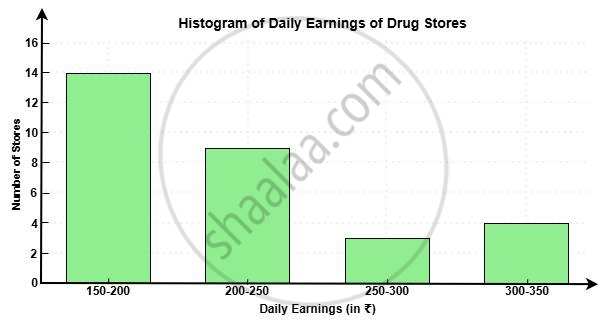
Here is the histogram representing the daily earnings of 20 drug stores. Each bar shows the number of stores falling within a given earnings range.
shaalaa.com
Is there an error in this question or solution?
