Advertisements
Advertisements
प्रश्न
For following distribution, draw a histogram:
| Class | 1 – 10 | 11 – 20 | 21 – 30 | 31 – 40 | 41 – 50 | 51 – 60 |
| Frequency | 7 | 3 | 5 | 2 | 6 | 4 |
आलेख
Advertisements
उत्तर
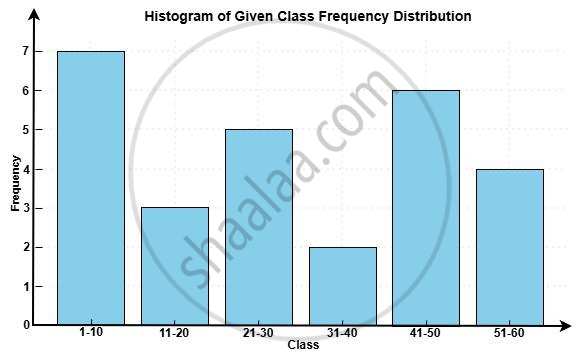
Here’s the histogram representing the given class frequency distribution. Each bar shows the number of observations (frequency) for the corresponding class interval.
shaalaa.com
या प्रश्नात किंवा उत्तरात काही त्रुटी आहे का?
