Advertisements
Advertisements
Question
For the pair of linear equations given below, draw graphs and then state, whether the lines drawn are parallel or perpendicular to each other.
y = x - 3
y = - x + 5
Advertisements
Solution
To draw the graph of y = x - 3 and y = - x + 5 follows the steps:
First, prepare a table as below:
| X | - 1 | 0 | 1 |
| Y = x - 3 | - 4 | -3 | - 2 |
| Y = - x + 5 | 6 | 5 | 4 |
Now sketch the graph as shown:
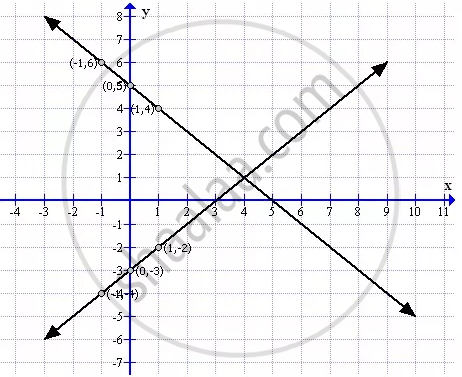
From the graph it can verify that the lines are perpendicular.
APPEARS IN
RELATED QUESTIONS
Draw the graph for the linear equation given below:
5x+ y = 0.
Draw the graph for the linear equation given below:
y = 2x + 3
Draw the graph for the linear equation given below:
`(x - 1)/(3) - (y + 2)/(2) = 0`
Draw the graph for the linear equation given below:
x - 3 = `(2)/(5)(y + 1)`
Draw the graph for the equation given below:
`(1)/(2) x + (2)/(3) y = 5`.
Draw a graph of each of the following equations: x + 6y = 15
Draw a graph of each of the following equations: 5x + 2y = 16
Draw a graph of each of the following equations: y = `(5)/(2) xx + (2)/(5)`
Draw a graph of each of the following equations: `(x - 2)/(3) - (y + 1)/(2)` = 0
Draw the graph of the lines represented by the equations 3x - 2y = 4 and x + y = 3 on the same graph. Find the coordinates of the point where they intersect. State, whether the lines are perpendicular to each other.
