Advertisements
Advertisements
प्रश्न
With the help of the graph answer the following -
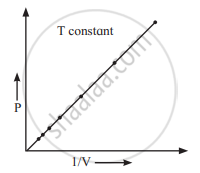
At constant temperature, the Graph shows the relationship between pressure and volume. Represent the relation mathematically.
Advertisements
उत्तर
P `prop 1/"V"`
APPEARS IN
संबंधित प्रश्न
Explain Why?
"When stating the volume of a gas, the pressure and temperature should also be given."
State (i) the three variables for gas laws and (ii) SI units of these variables.
Give reason for the following:
Gases exert pressure in all directions.
What is meant by aqueous tension? How is the pressure exerted by a gas corrected to account for aqueous tension?
Convert the following pressure value into Pascals.
10 atmosphere
Convert the following pressure value into Pascals.
1 kPa
Convert exactly 1.5 atm to pascals
Convert 0.124 torr to the standard atmosphere
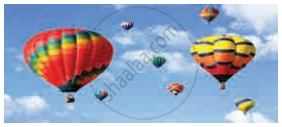
Hot air balloons float in the air because of the low density of the air inside the balloon. Explain this with the help of an appropriate gas law.
Consider a sample of a gas in a cylinder with a movable piston.
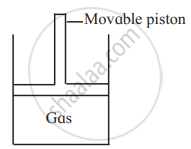
Show diagrammatically the changes in the position of the piston, if pressure is increased from 1.0 bar to 2.0 bar at a constant temperature.
Write the statement for Charles’ law
With the help of the graph answer the following -
At constant temperature, Write the statement of law.
Solve the following.
A balloon is inflated with helium gas at room temperature of 25°C and at 1 bar pressure when its initial volume is 2.27L and allowed to rise in the air. As it rises in the air external pressure decreases and the volume of the gas increases till finally, it bursts when external pressure is 0.3bar. What is the limit at which the volume of the balloon can stay inflated?
Assertion: Critical temperature of CO2 is 304 K, it can be liquefied above 304 K.
Reason: For a given mass of gas, volume is to directly proportional to pressure at constant temperature
Name two items that can serve as a model for Gay Lusaac’s law and explain.
Explain the following observation.
The type of an automobile is inflated to slightly lesser pressure in summer than in winter
A sample of gas at 15°C at 1 atm. has a volume of 2.58 dm3. When the temperature is raised to 38°C at 1 atm does the volume of the gas Increase? If so, calculate the final volume.
A sample of gas has a volume of 8.5 dm3 at an unknown temperature. When the sample is submerged in ice water at 0°C, its volume gets reduced to 6.37 dm3. What is its initial temperature?
Sulphur hexafluoride is a colourless, odourless gas; calculate the pressure exerted by 1.82 moles of the gas in a steel vessel of volume 5.43 dm3 at 69.5 °C, assuming ideal gas behaviour
Hydrochloric acid is treated with a metal to produce hydrogen gas. Suppose a student carries out this reaction and collects a volume of 154.4 × 10⁻³ dm3 of a gas at a pressure of 742 mm of Hg at a temperature of 298 K. What mass of hydrogen gas (in mg) did the student collect?
According to Andrews isothermals, the minimum temperature at which carbon dioxide gas obeys Boyles law is ______.
According to Andrews isothermals at what temperature the carbon dioxide gas starts to condense at 73 atmosphere?
The volume of 400 cm3 chlorine gas at 400 mm of Hg is decreased to 200 cm3 at constant temperature. What is the new pressure of gas?
10 g of gas at one atomospheric pressure is cooled from 273.15°C to 0°C keeping the volume constant. What is the final pressure?
If 300 mL of a gas at 26.85°C is cooled to 6.85°C at constant pressure. What will be the final volume of gas?
Identify the correct relationship between pressure (P), density (d), molar mass (M) and Temperature (T) for an ideal gas from the following.
