Advertisements
Advertisements
प्रश्न
With the help of the graph answer the following -
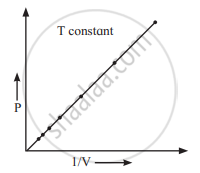
At constant temperature, the Graph shows the relationship between pressure and volume. Represent the relation mathematically.
Advertisements
उत्तर
P `prop 1/"V"`
APPEARS IN
संबंधित प्रश्न
What would be the mass of CO2 occupying a volume of 44 litres at 25°C and 750 mm pressure.
Convert the following temperature from degree Celcius to kelvin.
−197° C
Convert the following temperature from degree Celcius to kelvin.
273° C
Convert the following pressure value into Pascals.
107000 Nm−2
Identify the gas laws from the following diagram.
| Diagram | Gas laws |
 |
______________ |
Consider a sample of a gas in a cylinder with a movable piston.
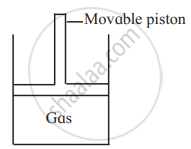
Show diagrammatically the changes in the position of the piston, if pressure is increased from 1.0 bar to 2.0 bar at a constant temperature.
Consider a sample of a gas in a cylinder with a movable piston.
Show diagrammatically the changes in the position of the piston, if the temperature is decreased from 400 K to 300 K, and pressure is decreased from 4 bar to 3 bar.
Match the pairs of the following:
| Column ‘A’ | Column ‘B’ |
| a. Boyle’s law | i. at constant pressure and volume |
| b. Charles’ law | ii. at constant temperature |
| iii. at constant pressure |
Solve the following.
A balloon is inflated with helium gas at room temperature of 25°C and at 1 bar pressure when its initial volume is 2.27L and allowed to rise in the air. As it rises in the air external pressure decreases and the volume of the gas increases till finally, it bursts when external pressure is 0.3bar. What is the limit at which the volume of the balloon can stay inflated?
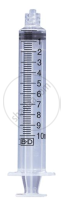
Solve the following.
A syringe has a volume of 10.0 cm3 at pressure 1 atm. If you plug the end so that no gas can escape and push the plunger down, what must be the final volume to change the pressure to 3.5 atm?
Solve the following.
The volume of a given mass of a gas at 0°C is 2 dm3. Calculate the new volume of the gas at constant pressure when the temperature is increased by 10°C.
Solve the following.
A hot air balloon has a volume of 2800 m3 at 99°C. What is the volume if the air cools to 80°C?

State Boyle's law.
Explain the following observation.
Aerated water bottles are kept under water during summer
Explain the following observation.
The size of a weather balloon becomes larger and larger as it ascends up to larger altitude
A sample of gas has a volume of 8.5 dm3 at an unknown temperature. When the sample is submerged in ice water at 0°C, its volume gets reduced to 6.37 dm3. What is its initial temperature?
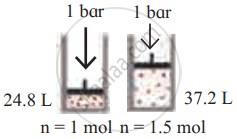
Of two samples of nitrogen gas, sample A contains 1.5 moles of nitrogen in a vessel of the volume of 37.6 dm3 at 298 K, and sample B is in a vessel of volume 16.5 dm3 at 298 K. Calculate the number of moles in sample B.
Sulphur hexafluoride is a colourless, odourless gas; calculate the pressure exerted by 1.82 moles of the gas in a steel vessel of volume 5.43 dm3 at 69.5 °C, assuming ideal gas behaviour
Hydrochloric acid is treated with a metal to produce hydrogen gas. Suppose a student carries out this reaction and collects a volume of 154.4 × 10⁻³ dm3 of a gas at a pressure of 742 mm of Hg at a temperature of 298 K. What mass of hydrogen gas (in mg) did the student collect?
A certain sample of gas has a volume of 0.2 L at one atmosphere pressure and 273.15 K. What is the volume of gas at 273.15°C at same pressure?
Volume of a balloon at 25°C and 1 bar pressure is 2.27 L. If the pressure of the gas in balloon is reduced to 0.227 bar, what is the rise in volume of a gas?
According to Andrews isothermals at what temperature the carbon dioxide gas starts to condense at 73 atmosphere?
Isochor is the graph plotted between ______.
The volume of 400 cm3 chlorine gas at 400 mm of Hg is decreased to 200 cm3 at constant temperature. What is the new pressure of gas?
At what temperature, the volume of gas would become zero?
