Advertisements
Advertisements
प्रश्न
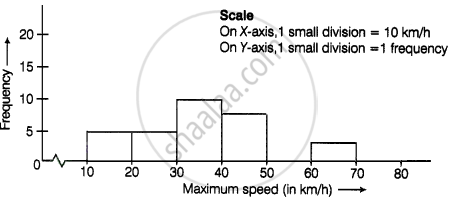
The top speeds of thirty different land animals have been organised into a frequency table. Draw a histogram for the given data.
| Maximum Speed (km/h) | Frequency |
| 10 – 20 | 5 |
| 20 – 30 | 5 |
| 30 – 40 | 10 |
| 40 – 50 | 8 |
| 50 – 60 | 0 |
| 60 – 70 | 2 |
Advertisements
उत्तर
APPEARS IN
संबंधित प्रश्न
The number of hours for which students of a particular class watched television during holidays is shown through the given graph.
Answer the following
1) For how many hours did the maximum number of students watch TV?
2) How many students watched TV for less than 4 hours?
3) How many students spent more than 5 hours in watching TV?

Draw histogram for the following frequency distributions:
| Class Interval | 10 – 16 | 16 – 22 | 22 – 28 | 28 – 34 | 34 – 40 |
| Frequency | 15 | 23 | 30 | 20 | 16 |
The table below shows the yield of jowar per acre. Show the data by histogram.
| Yield per acre (quintal) | 2 - 3 | 4 - 5 | 6 - 7 | 8 - 9 | 10 - 11 |
| No. of farmers | 30 | 50 | 55 | 40 | 20 |
Number of workshops organized by a school in different areas during the last five years are as follows:
| Years | No. of workshops |
| 1995−1996 | 25 |
| 1996−1997 | 30 |
| 1997−1998 | 42 |
| 1998−1999 | 50 |
| 1999−2000 | 65 |
Draw a histogram representing the above data.
The following histogram shows the number of literate females in the age group of 10 to 40 years in a town:
(i) Write the age group in which the number of literate female is the highest.
(ii) What is the class width?
(iii) What is the lowest frequency?
(iv) What are the class marks of the classes?
(v) In which age group literate females are the least?
Construct histograms for following frequency distribution:
| Class Interval | 0-10 | 10-20 | 20-30 | 30-40 | 40-50 | 50-60 |
| Frequency | 8 | 20 | 34 | 22 | 10 | 6 |
Construct histograms for following frequency distribution:
| Class Interval | 110-119 | 120-129 | 130-139 | 140-149 | 150-159 |
| Frequency | 15 | 23 | 30 | 20 | 16 |
Construct histograms for following frequency distribution:
| Class Interval | 1-10 | 11-20 | 21-30 | 31-40 | 41-50 |
| Frequency | 11 | 23 | 30 | 20 | 16 |
Construct histograms for following frequency distribution:
| Class Interval | 130-140 | 140-150 | 150-160 | 160-170 | 170-180 |
| Frequency | 24 | 16 | 29 | 20 | 11 |
Represent the following data by histogram:
| Price of sugar Per kg (in Rs) | Number of weeks |
| 28-30 | 4 |
| 30-32 | 8 |
| 32-34 | 22 |
| 34-36 | 12 |
| 36-38 | 6 |
Identify the following data can be represented in a histogram?
Production of cycles in different years
Draw a histogram for the following data.
| Class Interval | 0 − 10 | 10 − 20 | 20 − 30 | 30 − 40 | 40 − 50 | 50 − 60 |
| No. of students | 5 | 15 | 23 | 20 | 10 | 7 |
The marks obtained by 50 students in Mathematics are given below.
(i) Make a frequency distribution table taking a class size of 10 marks
(ii) Draw a histogram and a frequency polygon.
| 52 | 33 | 56 | 52 | 44 | 59 | 47 | 61 | 49 | 61 |
| 47 | 52 | 67 | 39 | 89 | 57 | 64 | 58 | 63 | 65 |
| 32 | 64 | 50 | 54 | 42 | 48 | 22 | 37 | 59 | 63 |
| 36 | 35 | 48 | 48 | 55 | 62 | 74 | 43 | 41 | 51 |
| 08 | 71 | 30 | 18 | 43 | 28 | 20 | 40 | 58 | 49 |
Draw a histogram and the frequency polygon in the same diagram to represent the following data
| Weight (in kg) | 50 − 55 | 56 − 61 | 62 − 67 | 68 − 73 | 74 − 79 | 80 − 85 | 86 − 91 |
| No. of persons | 15 | 8 | 12 | 17 | 9 | 10 | 6 |
Form a continuous frequency distribution table and draw histogram from the following data.
| Age (in years) | No. of persons |
| Under 5 | 1 |
| Under 10 | 12 |
| Under 15 | 19 |
| Under 20 | 26 |
| Under 25 | 27 |
| Under 30 | 35 |
| Under 35 | 38 |
| Under 40 | 45 |
| Under 45 | 48 |
| Under 50 | 53 |
Draw a histogram for the following data.
| Mid Value (x) | 15 | 25 | 35 | 45 | 55 | 65 | 75 |
| Frequency (f) | 12 | 24 | 30 | 18 | 26 | 10 | 8 |
Look at the histogram below and answer the questions that follow.

- How many students have height more than or equal to 135 cm but less than 150 cm?
- Which class interval has the least number of students?
- What is the class size?
- How many students have height less than 140 cm?
The below histogram shows the number of literate females in the age group of 10 to 40 years in a town.

- Write the classes assuming all the classes are of equal width.
- What is the classes width?
- In which age group are literate females the least?
- In which age group is the number of literate females the highest?
Use graph paper for this question. Estimate the mode of the given distribution by plotting a histogram. [Take 2 cm = 10 marks along one axis and 2 cm = 5 students along the other axis]
| Daily wages (in ₹) | 30 - 40 | 40 - 50 | 50 - 60 | 60 - 70 | 70 - 80 |
| No. of Workers | 6 | 12 | 20 | 15 | 9 |
