Advertisements
Advertisements
प्रश्न
The distance of any point from the x-axis is called the x-coordinate.
विकल्प
True
False
Advertisements
उत्तर
This statement is False.
Explanation:
The distance of any point from x-axis is called its y-coordinate and the distance of a point from y-axis is called its x-coordinate.
APPEARS IN
संबंधित प्रश्न
Plot the following points on a graph sheet. Verify if they lie on a line
P(1, 1), Q(2, 2), R(3, 3), S(4, 4)
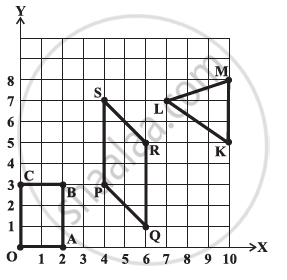
Write the coordinates of the vertices of each of these adjoining figures.
The following table gives the information regarding the number of persons employed to a piece of work and time taken to complete the work:
| Number of persons: | 2 | 4 | 6 | 8 |
| Time taken (in days): | 12 | 6 | 4 | 3 |
Plot a graph of this information.
In the given figure the position of the book on the table may be given by ______.
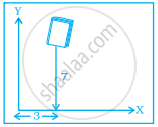
In the coordinates of a point, the second number denotes the ______.
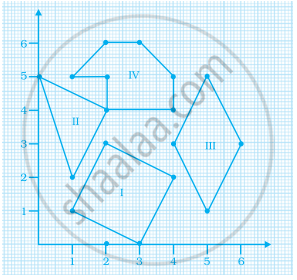
Find the coordinates of the vertices of the given figures.
The two graphs below compare Car A and Car B. The left graph shows the relationship between age and value. The right graph shows the relationship between size and maximum speed.
 |
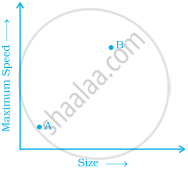 |
Use the graphs to determine whether each statement is true or false, and explain your answer.
- The older car is less valuable.
- The faster car is larger.
- The larger car is older.
- The faster car is older.
- The more valuable car is slower.
