Advertisements
Advertisements
प्रश्न
Calculate the time required to heat 20 kg of water from 10°C to 35°C using an immersion heater rated 1000 W. Assume that 80% of the power input is used to heat the water. Specific heat capacity of water = 42000 J kg−1 K−1.
Advertisements
उत्तर
Given:-
Power rating of the immersion rod, P = 1000 W
Specific heat of water, S = 4200 J kg−1 K−1
Mass of water, M = 20 kg
Change in temperature, ΔT = 25 °C
Total heat required to raise the temperature of 20 kg of water from 10°C to 35°C is given by
Q = M × S × ΔT
Q = 20 × 4200 × 25
Q = 20 × 4200 × 25 = 21 × 105 J
Let the time taken to heat 20 kg of water from 10°C to 35°C be t. Only 80% of the immersion rod's heat is useful for heating water. Thus,
Energy of the immersion rod utilised for heating the water = t × (0.80) × 1000 J
t × (0.80) × 1000 J = 21 × 105 J
`t=(21xx10^5)/800=2625s`
`rArrt=2625/60=43.75minapprox44min`
APPEARS IN
संबंधित प्रश्न
Give reason for Sea water does not freeze at 0°C.
Observe the following graph. Considering the change in volume of water as its temperature is raised from 0°C, discuss the difference in the behaviour of water and other substances. What is this behaviour of water called?

Explain the following:
In cold regions in winter, the rocks crack due to anomalous expansion of water.
On a winter day the temperature of the tap water is 20°C whereas the room temperature is 5°C. Water is stored in a tank of capacity 0.5 m3 for household use. If it were possible to use the heat liberated by the water to lift a 10 kg mass vertically, how high can it be lifted as the water comes to the room temperature? Take g = 10 m s−2.
A calorimeter contains 50 g of water at 50°C. The temperature falls to 45°C in 10 minutes. When the calorimeter contains 100 g of water at 50°C, it takes 18 minutes for the temperature to become 45°C. Find the water equivalent of the calorimeter.
Describe an experiment to show that water has maximum density at 4°C. What important consequences follow this peculiar property of water? Discuss the importance of this phenomenon in nature.
Water is cooled from 4 °C to 0 °C. It will :
What do you understand by the anomalous expansion of water?
Explain, why does a glass bottle completely filled with water and tightly capped burst when placed in a freezer?
A deep pond of water has its top layer frozen. What will be the likely temperature of water layer just in contact with ice?
What are hot spots? How can you extract energy from a hot spot, if it does not come in contact with underground water?
What are land and sea breezes? Explain with the help of a labeled diagram.
What will be the approximate temperature of water in the lake shown in the following diagram?
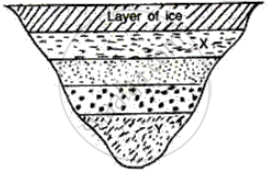
(i) At X, and
(ii) At Y?
In cold regions, in winter the pipes for water supply break.
Write scientific reason.
Fish can survive even in frozen ponds in cold regions.
Observe the following diagram and write the answers to the questions given below.
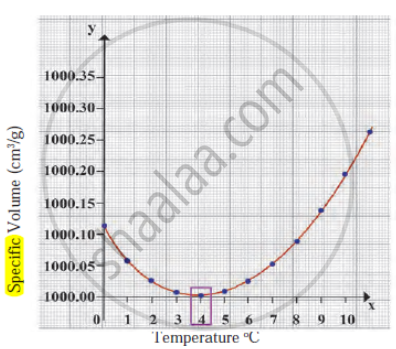
- Which process does the graph represent?
- What is the range of temperature responsible for the behaviour?
Match the columns:
| Column ‘A’ | Column ‘B’ |
| The density of water is maximum at | (a) 0°C |
| (b) 4°C | |
| (c) 100°C |
