Advertisements
Advertisements
प्रश्न
Answer the following question.
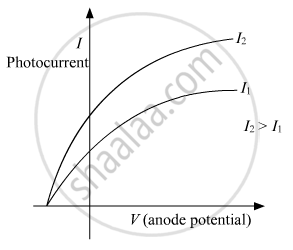
Plot a graph of photocurrent versus anode potential for radiation of frequency ν and intensities I1 and I2 (I1 < I2).
Advertisements
उत्तर
Graph of photocurrent versus anode potential for radiation of frequency ν and intensities I1 and I2 (I1 < I2):
APPEARS IN
संबंधित प्रश्न
In an experiment on photoelectric effect, a photon is incident on an electron from one direction and the photoelectron is emitted almost in the opposite direction. Does this violate the principle of conservation of momentum?
Photoelectric effect supports quantum nature of light because
(a) there is a minimum frequency below which no photoelectrons are emitted
(b) the maximum kinetic energy of photoelectrons depends only on the frequency of light and not on its intensity
(c) even when the metal surface is faintly illuminated the photoelectrons leave the surface immediately
(d) electric charge of the photoelectrons is quantised
A photon of energy hv is absorbed by a free electron of a metal with work-function hv − φ.
In which of the following situations, the heavier of the two particles has smaller de Broglie wavelength? The two particles
(a) move with the same speed
(b) move with the same linear momentum
(c) move with the same kinetic energy
(d) have fallen through the same height
An atom absorbs a photon of wavelength 500 nm and emits another photon of wavelength 700 nm. Find the net energy absorbed by the atom in the process.
(Use h = 6.63 × 10⁻³⁴J-s = 4.14 × 10⁻¹⁵ eV-s, c = 3 × 10⁸ m/s and me = 9.1 × 10⁻³¹kg)
A 100 W light bulb is placed at the centre of a spherical chamber of radius 20 cm. Assume that 60% of the energy supplied to the bulb is converted into light and that the surface of the chamber is perfectly absorbing. Find the pressure exerted by the light on the surface of the chamber.
(Use h = 6.63 × 10⁻³⁴J-s = 4.14 × 10⁻¹⁵ eV-s, c = 3 × 10⁸ m/s and me = 9.1 × 10⁻³¹kg)
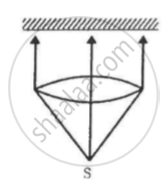
A totally reflecting, small plane mirror placed horizontally faces a parallel beam of light, as shown in the figure. The mass of the mirror is 20 g. Assume that there is no absorption in the lens and that 30% of the light emitted by the source goes through the lens. Find the power of the source needed to support the weight of the mirror.
(Use h = 6.63 × 10⁻³⁴J-s = 4.14 × 10⁻¹⁵ eV-s, c = 3 × 10⁸ m/s and me = 9.1 × 10⁻³¹kg)
The work function of a photoelectric material is 4.0 eV. (a) What is the threshold wavelength? (b) Find the wavelength of light for which the stopping potential is 2.5 V.
(Use h = 6.63 × 10⁻³⁴J-s = 4.14 × 10⁻¹⁵ eV-s, c = 3 × 10⁸ m/s and me = 9.1 × 10⁻³¹kg)
Find the maximum magnitude of the linear momentum of a photoelectron emitted when a wavelength of 400 nm falls on a metal with work function 2.5 eV.
(Use h = 6.63 × 10⁻³⁴J-s = 4.14 × 10⁻¹⁵ eV-s, c = 3 × 10⁸ m/s and me = 9.1 × 10⁻³¹kg)
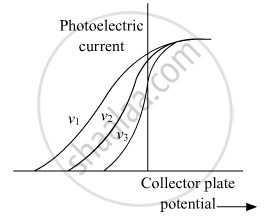
On the basis of the graphs shown in the figure, answer the following questions :
(a) Which physical parameter is kept constant for the three curves?
(b) Which is the highest frequency among v1, v2, and v3?
