Advertisements
Advertisements
Question
Answer the following question.
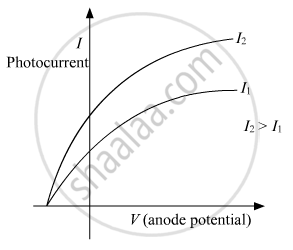
Plot a graph of photocurrent versus anode potential for radiation of frequency ν and intensities I1 and I2 (I1 < I2).
Advertisements
Solution
Graph of photocurrent versus anode potential for radiation of frequency ν and intensities I1 and I2 (I1 < I2):
APPEARS IN
RELATED QUESTIONS
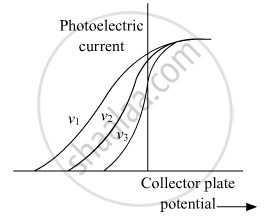
On the basis of the graphs shown in the figure, answer the following questions :
(a) Which physical parameter is kept constant for the three curves?
(b) Which is the highest frequency among v1, v2, and v3?
Explain how does (i) photoelectric current and (ii) kinetic energy of the photoelectrons emitted in a photocell vary if the frequency of incident radiation is doubled, but keeping the intensity same?
Show the graphical variation in the above two cases.
Consider a metal exposed to light of wavelength 600 nm. The maximum energy of the electron doubles when light of wavelength 400 nm is used. Find the work function in eV.
The graph shows the variation of photocurrent for a photosensitive metal
- What does X and A on the horizontal axis represent?
- Draw this graph for three different values of frequencies of incident radiation ʋ1, ʋ2 and ʋ3 (ʋ3 > ʋ2 > ʋ1) for the same intensity.
- Draw this graph for three different values of intensities of incident radiation I1, I2 and I3 (I3 > I2 > I1) having the same frequency.
How would the stopping potential for a given photosensitive surface change if the frequency of the incident radiation were increased? Justify your answer.
The figure shows a plot of stopping potential (V0) versus `1/lambda`, where λ is the wavelength of the radiation causing photoelectric emission from a surface. The slope of the line is equal to ______.

Which part is the photosensitive metal plate?
What does emitter plate C do when light falls on it?
What is used to change light frequency and study its effect on emission and electron energy?
What happens if the frequency of incident radiation is below the threshold frequency?
