Advertisements
Chapters
1: Rational and Irrational Numbers
Unit 2: Commercial Mathematics
2: Compound Interest (Stage 1) [Basic Concepts]
3: Compound Interest (Stage 2) [Applications]
Unit 3: Algebra
4: Expansions
5: Factorisation
6: Simultaneous (Linear) Equations [Including Problems]
7: Indices [Exponents]
8: Logarithms
Unit 4: Geometry
9: Triangles [Congruency in Triangles]
10: Isosceles Triangles [Including Inequalities]
11: Mid-point Theorem and Its Converse [Including Intercept Theorem]
12: Pythagoras Theorem [Proof and Simple Applications with Converse]
13: Rectilinear Figures [Quadrilaterals: Parallelogram, Rectangle, Rhombus, Square and Trapezium]
14: Construction of Polygons (Using ruler and compass only)
15: Area Theorems [Proof and Use]
16: Circle
Unit 5: Statistics and Graph Work
▶ 17: Statistics
18: Mean and Median [For Ungrouped Data Only]
Unit 6: Mensuration
19: Area and Perimeter of Plane Figures
20: Solids [Surface Area and Volume of 3-D Solids]
Unit 7: Trigonometry
21: Trigonometrical Ratios [Sine, Consine, Tangent of an Angle and their Reciprocals]
22: Solution of Right Triangles [Simple 2-D Problems Involving One Right-angled Triangle]
Unit 8: Co-Ordinate
23: Co-ordinate Geometry
24: Graphical Solution [Solution of Simultaneous Linear Equations, Graphically]
25: Distance Formula
![Selina solutions for Concise Mathematics [English] Class 9 ICSE chapter 17 - Statistics - Shaalaa.com](/images/concise-mathematics-english-class-9-icse_6:e09935b48e334a1e8f06ebb2011509f8.jpg "Selina solutions for Concise Mathematics [English] Class 9 ICSE chapter 17 - Statistics")
Advertisements
Solutions for Chapter 17: Statistics
Below listed, you can find solutions for Chapter 17 of CISCE Selina for Concise Mathematics [English] Class 9 ICSE.
Selina solutions for Concise Mathematics [English] Class 9 ICSE 17 Statistics Exercise 17 [Pages 256 - 257]
Multiple Choice Type: Choose the correct answer from the options given below.
Which of the following variables are discrete?
daily temperature of your city
sizes of shoes
distance travelled by a man
time
The marks obtained by 15 students in a test (out of hundred) are given below:
81, 72, 90, 90, 80, 55, 72, 66, 69, 80, 36. 54, 62, 56 and 58
The range of data is:
46
54
90
100
The class-mark of the class 35-45 is ______.
35
45
40
42
In the class-intervals 1-10, 11-20, 21-30: the class 11-20 after adjustment is ______.
0.5-10.5
20.5-30.5
10.5-30.5
10.5-20.5
The class marks of a frequency distribution are 10, 15, 20, 25,... The class corresponding to the class mark 15 is ______.
12.5-17.5
12.5-17.5
10-20
10-20
10.25-17
10.25-17
14-16
14-16
State, the following variable is continuous or discrete:
number of children in your class.
Continuous variable.
Discrete variable.
State, the following variable is continuous or discrete:
Distance travelled by car.
Continuous variable.
Discrete variable.
State, the following variable is continuous or discrete:
Sizes of shoes.
Continuous variable.
Discrete variable.
State, the following variable is continuous or discrete: Time.
Continuous variable.
Discrete variable.
State, the following variable is continuous or discrete: Number of patients in a hospital.
Continuous variable.
Discrete variable.
Given below are the marks obtained by 30 students in an examination:
| 08 | 17 | 33 | 41 | 47 | 23 | 20 | 34 |
| 09 | 18 | 42 | 14 | 30 | 19 | 29 | 11 |
| 36 | 48 | 40 | 24 | 22 | 02 | 16 | 21 |
| 15 | 32 | 47 | 44 | 33 | 01 |
Taking class intervals 1-10, 11-20, ....., 41-50; make a frequency table for the above distribution.
The marks of 24 candidates in the subject mathematics are given below:
| 45 | 48 | 15 | 23 | 30 | 35 | 40 | 11 |
| 29 | 0 | 3 | 12 | 48 | 50 | 18 | 30 |
| 15 | 30 | 11 | 42 | 23 | 2 | 3 | 44 |
The maximum marks are 50. Make a frequency distribution taking class intervals 0 - 10, 10-20, .......
Fill in the blank :
A quantity which can very from one individual to another is called a .............
Fill in the blank :
Sizes of shoes are ........... variables.
Fill in the blank :
Daily temperatures is ........... variable.
Fill in the blank :
The range of data 7, 13, 6, 25, 18, 20, 16 is ............
Fill in the blank :
In the class interval 35 - 46; the lower limit is .......... and the upper limit is .........
Fill in the blank :
The class mark of class interval 22 - 29 is ...........
Find the actual lower class limits, upper-class limits and the mid-values of the classes:
10 - 19, 20 - 29, 30 - 39 and 40 - 49.
Find the actual lower and upper-class limits and also the class marks of the classes:
1.1 - 2.0, 2.1 -3.0 and 3.1 - 4.0.
Use the table given below to find:
(a) The actual class limits of the fourth class.
(b) The class boundaries of the sixth class.
(c) The class mark of the third class.
(d) The upper and lower limits of the fifth class.
(e) The size of the third class.
| Class Interval | Frequency |
| 30 - 34 | 7 |
| 35 - 39 | 10 |
| 40 - 44 | 12 |
| 45 - 49 | 13 |
| 50 - 54 | 8 |
| 55 - 59 | 4 |
Construct a cumulative frequency distribution table from the frequency table given below:
| Class Interval | Frequency |
| 0 -8 | 9 |
| 8 - 16 | 13 |
| 16 - 24 | 12 |
| 24 - 32 | 7 |
| 32 - 40 | 15 |
Construct a cumulative frequency distribution table from the frequency table given below:
| Class Interval | Frequency |
| 1 - 10 | 12 |
| 11 - 20 | 18 |
| 21 - 30 | 23 |
| 31 - 40 | 15 |
| 41 - 50 | 10 |
Construct a frequency distribution table from the following cumulative frequency distribution:
| Class Interval | Cumulative Frequency |
| 10 - 19 | 8 |
| 20 - 29 | 19 |
| 30- 39 | 23 |
| 40- 49 | 30 |
Construct a frequency distribution table from the following cumulative frequency distribution:
| C.I | C.F |
| 5 - 10 | 18 |
| 10 - 15 | 30 |
| 15 - 20 | 46 |
| 20 - 25 | 73 |
| 25 - 30 | 90 |
Construct a frequency polygon for the following distribution:
| Class-intervals | 0-4 | 4 - 8 | 8 - 12 | 12 - 16 | 16 - 20 | 20 - 24 |
| Frequency | 4 | 7 | 10 | 15 | 11 | 6 |
Construct a combined histogram and frequency polygon for the following frequency distribution:
| Class-Intervals | 10 - 20 | 20 - 30 | 30 - 40 | 40 - 50 | 50 - 60 |
| Frequency | 3 | 5 | 6 | 4 | 2 |
Construct a frequency polygon for the following data:
| Class-Intervals | 10-14 | 15-19 | 20-24 | 25-29 | 30-34 |
| Frequency | 5 | 8 | 12 | 9 | 4 |
The daily wages in a factory are distributed as follows:
|
Daily wages (in Rs.) |
125 - 175 |
175 - 225 |
225 - 275 |
275 - 325 |
325 - 375 |
|
Number of workers |
4 |
20 |
22 |
10 |
6 |
Draw a frequency polygon for this distribution.
Selina solutions for Concise Mathematics [English] Class 9 ICSE 17 Statistics TEST YOURSELF [Pages 258 - 259]
Multiple Choice Type: Choose the correct answer from the options given below.
The class-mark of class 19-30 is ______.
`(30 + 19)/2`
`(29.5 - 19.5)/2`
`(30.5 - 19)/2`
`(29.5 - 18.5)/2`
In a frequency distribution, the mid-value of a class is 10 and the width of the class is 6. The lower limit of the class is ______.
6
7
8
9
Statement (1): Let m be the mid-value and x be the upper limit of a class in a continuous frequency distribution, then lower limit of this class is 2m − x.
Statement (2): For a given class: `"lower limit + upper limit"/2` = mid-value of the class.
Both the statements are true.
Both the statements are false.
Statement 1 is true, and statement 2 is false.
Statement 1 is false, and statement 2 is true.
Assertion (A): 30 children were asked about the number of hours they watched TV programme every day. The results are recorded as under.
| Number of hours | 0-5 | 5-10 | 10-15 | 15-20 |
| Frequency | 8 | 16 | 4 | 2 |
Then the number of children who watched TV for 10 or more hours a day is 22.
Reason (R): The assertion is not correct as the required number is 4 + 2 = 6.
A is true, R is false.
A is false, R is true.
Both A and R are true and R is the correct reason for A.
Both A and R are true and R is the incorrect reason for A.
Construct a frequency table from the following data:
| Marks | No. of students |
| less than 10 | 6 |
| less than 20 | 15 |
| less than 30 | 30 |
| less than 40 | 39 |
| less than 50 | 53 |
| less than 60 | 70 |
Construct the frequency distribution table from the following cumulative frequency table:
| Ages | No. of students |
| Below 4 | 0 |
| Below 7 | 85 |
| Below 10 | 140 |
| Below 13 | 243 |
| Below 16 | 300 |
(i) State the number of students in the age group 10 - 13.
(ii) State the age-group which has the least number of students.
Fill in the blank in the following table:
| Class interval | Frequency | Cumulative Frequency |
| 25 - 34 | ...... | 15 |
| 35 - 44 | ...... | 28 |
| 45 - 54 | 21 | ...... |
| 55 - 64 | 16 | ...... |
| 65 - 74 | ...... | 73 |
| 75 - 84 | 12 | ...... |
The value of π up to 50 decimal place is
3.14159265358979323846264338327950288419716939937510
(i) Make a frequency distribution table of digits from 0 to 9 after the decimal place.
(ii) Which are the most and least occurring digits?
Draw frequency polygons for each of the following frequency distribution:
(a) using histogram
(b) without using histogram
|
C.I |
10 - 30 |
30 - 50 |
50 - 70 | 70 - 90 | 90 - 110 | 110 - 130 | 130 - 150 |
| ƒ | 4 | 7 | 5 | 9 | 5 | 6 | 4 |
Draw frequency polygons for each of the following frequency distribution:
(a) using histogram
(b) without using histogram
|
C.I |
5 -15 | 15 -25 | 25 -35 | 35 - 45 | 45-55 | 55-65 |
| ƒ | 8 | 16 | 18 | 14 | 8 | 2 |
Using the class intervals 0-9, 10-19, 20-29,..., construct the frequency distribution for: 15, 8, 12, 7, 13, 16, 22, 29, 35, 49, 37 and 48.
Construct the cumulative frequency table for:
| Marks | 20-29 | 30-39 | 40-49 | 50-59 |
| No. of students | 18 | 23 | 36 | 42 |
Construct a combined histogram and frequency polygon for the following frequency distribution:
| Class-intervals | 20-30 | 30-40 | 40-50 | 50-60 | 60-70 |
| Frequency | 8 | 12 | 15 | 10 | 3 |
Case-Study Based Question
Srikanth is a class IX Mathematics teacher in Chennai. After a class test, he asks a student to record the marks that all the students obtained. Narayanan scored the least marks 6 in the class and Keerthana scored the highest marks 59 in the class out of 60 marks. He prepares a frequency distribution table using the collected data and draws a histogram as shown below:
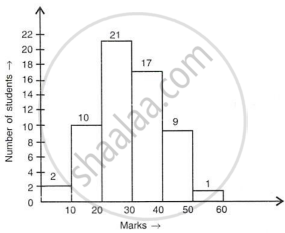
- What is the width of each class?
- What is the total number of students in class IX?
- How many students scored 50% and above marks?
- What is the range of the collected data?
Solutions for 17: Statistics
Selina solutions for Concise Mathematics [English] Class 9 ICSE chapter 17 - Statistics
Shaalaa.com has the CISCE Mathematics Concise Mathematics [English] Class 9 ICSE CISCE solutions in a manner that help students grasp basic concepts better and faster. The detailed, step-by-step solutions will help you understand the concepts better and clarify any confusion. Selina solutions for Mathematics Concise Mathematics [English] Class 9 ICSE CISCE 17 (Statistics) include all questions with answers and detailed explanations. This will clear students' doubts about questions and improve their application skills while preparing for board exams.
Further, we at Shaalaa.com provide such solutions so students can prepare for written exams. Selina textbook solutions can be a core help for self-study and provide excellent self-help guidance for students.
Concepts covered in Concise Mathematics [English] Class 9 ICSE chapter 17 Statistics are .
Using Selina Concise Mathematics [English] Class 9 ICSE solutions Statistics exercise by students is an easy way to prepare for the exams, as they involve solutions arranged chapter-wise and also page-wise. The questions involved in Selina Solutions are essential questions that can be asked in the final exam. Maximum CISCE Concise Mathematics [English] Class 9 ICSE students prefer Selina Textbook Solutions to score more in exams.
Get the free view of Chapter 17, Statistics Concise Mathematics [English] Class 9 ICSE additional questions for Mathematics Concise Mathematics [English] Class 9 ICSE CISCE, and you can use Shaalaa.com to keep it handy for your exam preparation.
