Advertisements
Advertisements
Question
Construct a frequency polygon for the following distribution:
| Class-intervals | 0-4 | 4 - 8 | 8 - 12 | 12 - 16 | 16 - 20 | 20 - 24 |
| Frequency | 4 | 7 | 10 | 15 | 11 | 6 |
Advertisements
Solution
The frequency polygon is shown in the following figure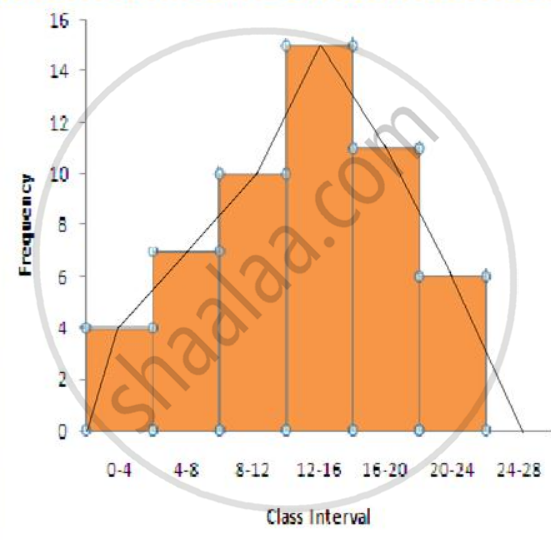
Steps:
(i) Drawing a histogram for the given data.
(ii) Marking the mid-point at the top of each rectangle of the histogram drawn.
(iii) Also, marking mid-point of the immediately lower class-interval and mid-point of the immediately higher class-interval.
(iv) Joining the consecutive mid-points marked by straight lines to obtain the required frequency polygon.
APPEARS IN
RELATED QUESTIONS
The runs scored by two teams A and B on the first 60 balls in a cricket match are given below:
| Number of balls | Team A | Team B |
| 1 - 6 | 2 | 5 |
| 7 - 12 | 1 | 6 |
| 13 - 18 | 8 | 2 |
| 19 - 24 | 9 | 10 |
| 25 - 30 | 4 | 5 |
| 31 - 36 | 5 | 6 |
| 37 - 42 | 6 | 3 |
| 43 - 48 | 10 | 4 |
| 49 - 54 | 6 | 8 |
| 55 - 60 | 2 | 10 |
Represent the data of both the teams on the same graph by frequency polygons.
[Hint: First make the class intervals continuous.]
Read the bar graph given in Fig. 23.19 and answer the following questions:
(i) What information is given by the bar graph?

(ii) In which years the areas under the sugarcane crop were the maximum and the minimum?
(iii) State whether true or false:
The area under the sugarcane crop in the year 1982 - 83 is three times that of the year 1950 - 51
Read the bar graph given in Fig. 23.21 and answer the following questions:
(i) What is the information given by the bar graph?
(ii) What is the number of families having 6 members?
(iii) How many members per family are there in the maximum number of families? Also tell the number of such families.
(iv) What are the number of members per family for which the number of families are equal? Also, tell the number of such families?
The following table shows the number of Maruti cars sold by five dealers in a particular month:
| Dealer: | Saya | Bagga Links | D.D. Motors | Bhasin Motors | Competent |
| Cars sold: | 60 | 40 | 20 | 15 | 10 |
Represent the above information by a pictograph.
The following table shows the interest paid by a company (in lakhs):
| Year | 1995-96 | 1996-97 | 1997-98 | 1998-99 | 1999-2000 |
| Interest (in lakhs of rupees | 20 | 25 | 15 | 18 | 30 |
Draw the bar graph to represent the above information.
The following data shows the average age of men in various countries in a certain year:
| Country | India | Nepal | China | Pakistan | U.K | U.S.A |
| Average age (in years) |
55 | 52 | 60 | 50 | 70 | 75 |
Represent the above information by a bar graph.
The expenditure (in 10 crores of rupees) on health by the Government of India during the various five year plans is shown below:
| Plans: | I | II | III | IV | V | VI |
| Expenditure on health (in 10 crores of rupees) |
7 | 14 | 23 | 34 | 76 | 182 |
Construct a bar graph to represent the above data.
The time taken, in seconds, to solve a problem by each of 25 pupils is as follows:
16, 20, 26, 27, 28, 30, 33, 37, 38, 40, 42, 43, 46, 46, 46, 48, 49, 50, 53, 58, 59, 60, 64, 52, 20
(a) Construct a frequency distribution for these data, using a class interval of 10 seconds.
(b) Draw a histogram to represent the frequency distribution.
Draw a histogram for the daily earnings of 30 drug stores in the following table:
| Daily earning (in Rs): |
450-500 | 500-550 | 550-600 | 600-650 | 650-700 |
| Number of Stores: | 16 | 10 | 7 | 3 | 1 |
The lengths of 62 leaves of a plant are measured in millimetres and the data is represented in the following table:
| Length (in mm) | Number of leaves |
| 118 – 126 | 8 |
| 127 – 135 | 10 |
| 136 – 144 | 12 |
| 145 – 153 | 17 |
| 154 – 162 | 7 |
| 163 – 171 | 5 |
| 172 – 180 | 3 |
Draw a histogram to represent the data above.
