Advertisements
Advertisements
Question
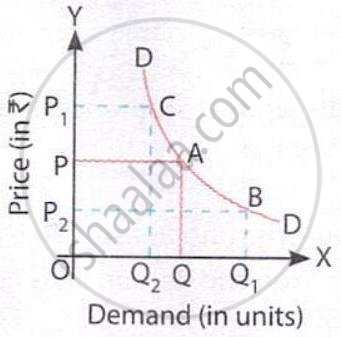
What does the following diagram represent?
Options
Change in Demand
Change in Quantity Demanded
Both (a) and (b)
Neither (a) nor (b)
MCQ
Advertisements
Solution
Change in Quantity Demanded
Explanation:
Both movements shown are along the same demand curve and result from changes in the good’s own price. This represents change in quantity demanded, not a shift in demand.
shaalaa.com
Is there an error in this question or solution?
