Advertisements
Advertisements
प्रश्न
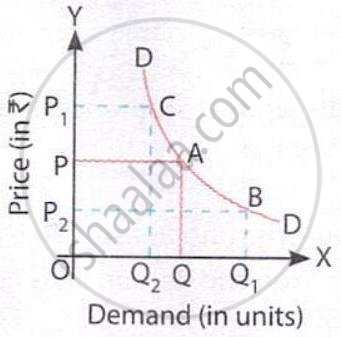
What does the following diagram represent?
विकल्प
Change in Demand
Change in Quantity Demanded
Both (a) and (b)
Neither (a) nor (b)
MCQ
Advertisements
उत्तर
Change in Quantity Demanded
Explanation:
Both movements shown are along the same demand curve and result from changes in the good’s own price. This represents change in quantity demanded, not a shift in demand.
shaalaa.com
क्या इस प्रश्न या उत्तर में कोई त्रुटि है?
