Advertisements
Advertisements
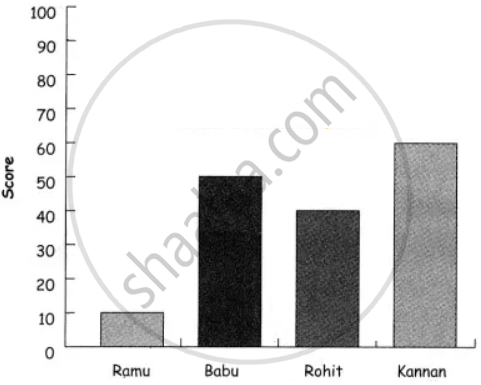
Question
The score card of the players in a cricket match is given.
| Player Name | Score |
| Kannan | 60 |
| Rohit | 40 |
| Babu | 50 |
| Ramu | 10 |
Draw a Bar diagram
Advertisements
Solution
APPEARS IN
RELATED QUESTIONS
This bar graph shows the maximum temperatures in degrees Celsius in different cities on a certain day in February. Observe the graph and answer the questions.

- What data is shown on the vertical and the horizontal lines?
- Which city had the highest temperature?
- Which cities had equal maximum temperatures?
- Which cities had a maximum temperature of 30° C?
- What is the difference between the maximum temperatures of Panchgani and Chandrapur?
Students planted trees in 5 villages of Sangli district. Make a bar graph of this data. (Scale: on Y-axis, 1cm = 100 trees)
| Name of place | Dudhgaon | Bagni | Samdoli | Ashta | Kavathepiran |
| No. of trees planted | 500 | 350 | 600 | 420 | 540 |
The following data gives total marks (out of 600) obtained by six children of a particular class. Represent the data on a bar graph.
| Students | Ajay | Bali | Dipti | Faiyaz | Geetika | Hari |
| Marks Obtained | 450 | 500 | 300 | 360 | 400 | 540 |
The fruits liked by the students of a class are as follow: Draw a Bar Graph for this data.
| Fruits | Bananas | Grapes | Apples | Mangoes | Guavas | Papayas | Other fruits |
| Number of students |
8 | 10 | 8 | 7 | 12 | 3 | 2 |
The horizontal and vertical line in a line graph are usually called ______ and ______.
The cost of a note book is Rs 10. Draw a graph after making a table showing cost of 2, 3, 4, .... note books. Use it to find
- the cost of 7 notebooks.
- the number of note books that can be purchased with Rs 50.
Home appliances sold by a shop in one month are given as below:
| Home appliance | Number of home appliances |
| Refrigerator | 75 |
| Television | 45 |
| Washing Machine | 30 |
| Cooler | 60 |
| DVD Player | 30 |
Draw a bar graph to represent the above information.
In a botanical garden, the number of different types of plants are found as follows:
| Type of the plants | Number of plants |
| Herb | 50 |
| Shrub | 60 |
| Creeper | 20 |
| Climber | 45 |
| Tree | 95 |
Draw a bar graph to represent the above information and answer the following questions:
- Which type of plant is maximum in number in the garden?
- Which type of plant is minimum in number in the garden?
A survey of 120 school students was done to find which activity they prefer to do in their free time.
| Preferred activity | Number of students |
| Playing | 45 |
| Reading story books | 30 |
| Watching TV | 20 |
| Listening to music | 10 |
| Painting | 15 |
Draw a bar graph to illustrate the above data taking a scale of 1 unit length = 5 students.
Which activity is preferred by most of the students other than playing?
A bar graph shows Gujiya (13 students), Jalebi (6 students), and Barfi (3 students). Which sweet is least preferred based on bar height?
