Advertisements
Advertisements
प्रश्न
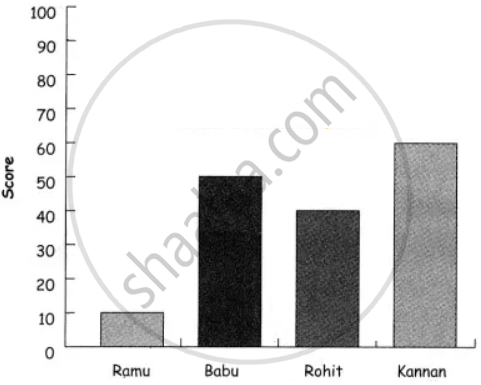
The score card of the players in a cricket match is given.
| Player Name | Score |
| Kannan | 60 |
| Rohit | 40 |
| Babu | 50 |
| Ramu | 10 |
Draw a Bar diagram
Advertisements
उत्तर
APPEARS IN
संबंधित प्रश्न
The table below gives the number of children who took part in the various items of the talent show as part of the annual school gathering. Make a bar graph to show this data.
(Scale: on Y-axis, 1cm = 4 children)
| Programme | Theatre | Dance | Vocal music | Instrumental music | One-act plays |
| No. of students | 24 | 40 | 16 | 8 | 4 |
Students planted trees in 5 villages of Sangli district. Make a bar graph of this data. (Scale: on Y-axis, 1cm = 100 trees)
| Name of place | Dudhgaon | Bagni | Samdoli | Ashta | Kavathepiran |
| No. of trees planted | 500 | 350 | 600 | 420 | 540 |
The following data gives total marks (out of 600) obtained by six children of a particular class. Represent the data on a bar graph.
| Students | Ajay | Bali | Dipti | Faiyaz | Geetika | Hari |
| Marks Obtained | 450 | 500 | 300 | 360 | 400 | 540 |
Chitra has to buy Laddus in order to distribute to her friends as follow: Draw a Bar Graph for this data
| Classes | VI | VII | VIII | IX | X |
| Number of Laddus | 70 | 60 | 45 | 80 | 55 |
A bar graph can be drawn using ______________
The following table represents income of a Gram Panchayat from different sources in a particular year:
| Sources | Income (in Rs.) |
| Income from local taxes | 75000 |
| Funds received from government | 150000 |
| Donations | 25000 |
| Income from other resources | 50000 |
Draw a bar graph to represent the above information.
In a botanical garden, the number of different types of plants are found as follows:
| Type of the plants | Number of plants |
| Herb | 50 |
| Shrub | 60 |
| Creeper | 20 |
| Climber | 45 |
| Tree | 95 |
Draw a bar graph to represent the above information and answer the following questions:
- Which type of plant is maximum in number in the garden?
- Which type of plant is minimum in number in the garden?
The number of people in various age groups in a town is given in the following table.
| Age group | 1-14 | 15-29 | 30-44 | 45-59 | 60-74 | 75 and above |
| Number of persons | 2 lakhs |
1 lakh |
1 lakh |
1 lakh |
80 thousand | 40 thousand |
Draw a bar graph to represent the above information and answer the following questions. (take 1 unit length = 20 thousands)
- Which two age groups have the same population?
- All persons in the age group of 60 and above are called senior citizens. How many senior citizens are there in the town?
In a vertical bar graph, what type of information is conventionally represented on the X-axis (Horizontal Axis)?
Which element is classified as representing the "numerical values (frequency, amount, or measure)" in a bar graph?
