Advertisements
Advertisements
प्रश्न
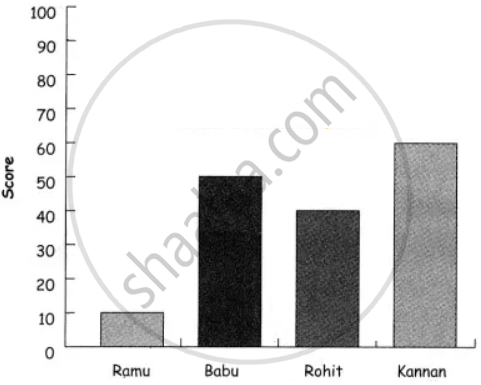
The score card of the players in a cricket match is given.
| Player Name | Score |
| Kannan | 60 |
| Rohit | 40 |
| Babu | 50 |
| Ramu | 10 |
Draw a Bar diagram
Advertisements
उत्तर
APPEARS IN
संबंधित प्रश्न
The number of customers who came to a juice centre for one week is given in the table below. Make two different bar graphs to show this data. (Scale: on Y-axis, 1cm = 10 customers, on Y - axis, 1cm = 5 customers)
| Type of juice | Orange | Pineapple | Apple | Mango | Pomegranate |
| No. of Customers | 50 | 30 | 25 | 65 | 10 |
Yashwant gives different amounts of time as shown below, to different exercises he does during the week. Draw a bar graph to show the details of his schedule using an appropriate scale.
| Type of exercise | Running | Yogasanas | Cycling | Mountaineering | Badminton |
| Time | 35 Minutes | 50 minutes | 1 hr 10 min | `1 1/2` hours | 45 minutes |
The fruits liked by the students of a class are as follow: Draw a Bar Graph for this data.
| Fruits | Bananas | Grapes | Apples | Mangoes | Guavas | Papayas | Other fruits |
| Number of students |
8 | 10 | 8 | 7 | 12 | 3 | 2 |
The lengths (in the nearest centimetre) of 30 drumsticks are given as follows.
| Lengths | Number of drumsticks |
| 24 | |||| |
| 25 | -- |
| 26 | -- |
| 27 | |||| | |
| 28 | -- |
| 29 | |||| ||| |
| 30 | |||| | |
| 31 | |||| |
Draw the bar graph showing the same information.
Data was collected on a student’s typing rate and graph was drawn as shown below. Approximately how many words had this student typed in 30 seconds?

Complete the given table and draw a graph.
| x | 0 | 1 | 2 | 3 |
| y = 3x + 1 | 1 | 4 | - | - |
The following table gives the data of number of schools (stage-wise) of a country in the year 2002.
| Stage | Number of schools (in thousands) |
| Primary | 80 |
| Upper Primary | 55 |
| Secondary | 30 |
| Higher Secondary | 20 |
Draw a bar graph to represent the above data:
A survey of 120 school students was done to find which activity they prefer to do in their free time.
| Preferred activity | Number of students |
| Playing | 45 |
| Reading story books | 30 |
| Watching TV | 20 |
| Listening to music | 10 |
| Painting | 15 |
Draw a bar graph to illustrate the above data taking a scale of 1 unit length = 5 students.
Which activity is preferred by most of the students other than playing?
A nursery has 70 Mogara plants, and the scale chosen is 1 cm = 10 plants. What should be the height of the bar representing Mogara?
In a vertical bar graph, what type of information is conventionally represented on the X-axis (Horizontal Axis)?
