Advertisements
Advertisements
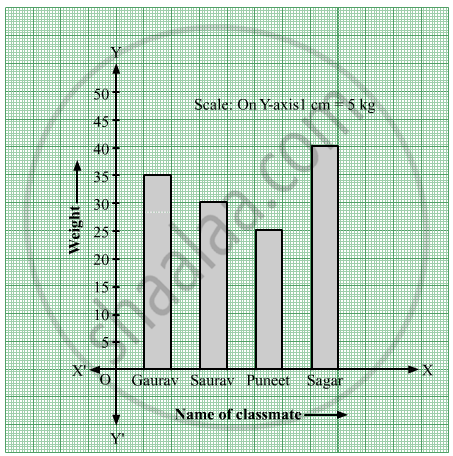
प्रश्न
Write the names of four of your classmates. Beside each name, write his/her weight in kilograms. Enter this data in a table like the above and make a bar graph.
Advertisements
उत्तर
| Name of classmate | Gaurav | Saurav | Puneet | Sagar |
| Weight | 35 kg | 30 kg | 25 kg | 40 kg |
Steps to draw the bar graph:
- In the centre of the graph paper, write the title "Classmates and their weights".
- Draw the X-axis and Y-axis, and mark O, their point of intersection.
- Write the name of classmates on the X-axis at equal distances.
- The weight is taken on the Y-axis.
- Write the scale in the top right-hand corner i.e. 1 cm = 5 kg on the Y-axis.
- Draw a bar of the appropriate height above the name of each classmate on the X-axis.
संबंधित प्रश्न
Yashwant gives different amounts of time as shown below, to different exercises he does during the week. Draw a bar graph to show the details of his schedule using an appropriate scale.
| Type of exercise | Running | Yogasanas | Cycling | Mountaineering | Badminton |
| Time | 35 Minutes | 50 minutes | 1 hr 10 min | `1 1/2` hours | 45 minutes |
The following data gives total marks (out of 600) obtained by six children of a particular class. Represent the data on a bar graph.
| Students | Ajay | Bali | Dipti | Faiyaz | Geetika | Hari |
| Marks Obtained | 450 | 500 | 300 | 360 | 400 | 540 |
The table shows the number of moons that orbit each of the planets in our solar system.
| Planet | Mercury | Venus | Earth | Mars | Jupiter | Saturn | Uranus | Neptune |
| Number of Moons |
0 | 0 | 1 | 2 | 28 | 30 | 21 | 8 |
Make a Bar graph for the above data
The cost of a notebook is Rs 10. Draw a graph after making a table showing cost of 2, 3, 4, .... notebooks. Use it to find the number of note books that can be purchased with Rs 50
Draw a graph for the radius and circumference of circle using a suitable scale.
(Hint: Take radius = 7, 14, 21 units and so on)
From the graph,
- Find the circumference of the circle when radius is 42 units.
- At what radius will the circumference of the circle be 220 units?
The number of ATMs of different banks in a city is shown below:
| Bank | Number of ATMs |
| Syndicate Bank | 5 |
| Dena Bank | 15 |
| Indian Bank | 20 |
| State Bank of India | 25 |
| Vijaya Bank | 10 |
Draw a bar graph to represent the above information by choosing the scale of your choice.
In a botanical garden, the number of different types of plants are found as follows:
| Type of the plants | Number of plants |
| Herb | 50 |
| Shrub | 60 |
| Creeper | 20 |
| Climber | 45 |
| Tree | 95 |
Draw a bar graph to represent the above information and answer the following questions:
- Which type of plant is maximum in number in the garden?
- Which type of plant is minimum in number in the garden?
The following table shows the number of bicycles manufactured in a factory from the years 1998 to 2002. Illustrate this data using a bar graph. Choose a scale of your choice.
| Years | Number of bicycles manufactured |
| 1998 | 800 |
| 1999 | 600 |
| 2000 | 900 |
| 2001 | 1100 |
| 2002 | 1200 |
- In which year was the maximum number of bicycles manufactured?
- In which year was the minimum number of bicycles manufactured?
In a vertical bar graph, what type of information is conventionally represented on the X-axis (Horizontal Axis)?
Which element is classified as representing the "numerical values (frequency, amount, or measure)" in a bar graph?
