Advertisements
Advertisements
प्रश्न
The following table shows the number of bicycles manufactured in a factory from the years 1998 to 2002. Illustrate this data using a bar graph. Choose a scale of your choice.
| Years | Number of bicycles manufactured |
| 1998 | 800 |
| 1999 | 600 |
| 2000 | 900 |
| 2001 | 1100 |
| 2002 | 1200 |
- In which year was the maximum number of bicycles manufactured?
- In which year was the minimum number of bicycles manufactured?
Advertisements
उत्तर
By taking a scale of 1 unit length = 100 bicycles, we may draw a bar graph of the above data as follows:
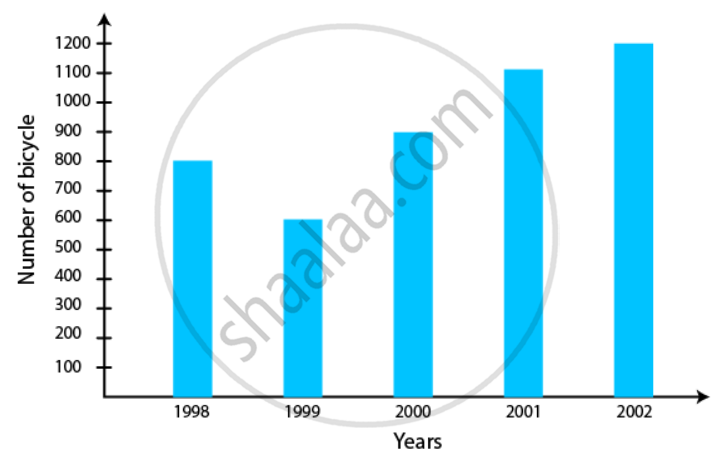
- In the year 2002, the maximum number of bicycles were manufactured, i.e., 1200 bicycles.
- In the year 1999, the minimum number of bicycles were manufactured, i.e., 600 bicycles.
संबंधित प्रश्न
The number of customers who came to a juice centre for one week is given in the table below. Make two different bar graphs to show this data. (Scale: on Y-axis, 1cm = 10 customers, on Y - axis, 1cm = 5 customers)
| Type of juice | Orange | Pineapple | Apple | Mango | Pomegranate |
| No. of Customers | 50 | 30 | 25 | 65 | 10 |
Read the given Bar Graph which shows the percentage of marks obtained by Brinda in different subjects in an assessment test.
Observe the Bar Graph and answer the following questions.
(i) 1 Unit = __________% of marks on vertical line.
(ii) Brinda has scored maximum marks in __________ subject.
(iii) Brinda has scored minimum marks in __________ subject.
(iv) The percentage of marks scored by Brinda in Science is __________.
(v) Brinda scored 60% marks in the subject __________.
(vi) Brinda scored 20% more in __________ subject than __________ subject.
Chitra has to buy Laddus in order to distribute to her friends as follow: Draw a Bar Graph for this data
| Classes | VI | VII | VIII | IX | X |
| Number of Laddus | 70 | 60 | 45 | 80 | 55 |
The fruits liked by the students of a class are as follow: Draw a Bar Graph for this data.
| Fruits | Bananas | Grapes | Apples | Mangoes | Guavas | Papayas | Other fruits |
| Number of students |
8 | 10 | 8 | 7 | 12 | 3 | 2 |
A bar graph can be drawn using ______________
The bar graph illustrates the results of a survey conducted on vehicles crossing over a Toll Plaza in one hour.
Observe the bar graph carefully and fill up the following table.
| Vehicles | Buses | _____ | Cars | Vans | _____ | Others | Total vehicles |
| Number of Vehicles |
_____ | 45 | _____ | _____ | 30 | ______ | ______ |
The cost of a notebook is Rs 10. Draw a graph after making a table showing cost of 2, 3, 4, .... notebooks. Use it to find the number of note books that can be purchased with Rs 50
Draw a graph for the radius and circumference of circle using a suitable scale.
(Hint: Take radius = 7, 14, 21 units and so on)
From the graph,
- Find the circumference of the circle when radius is 42 units.
- At what radius will the circumference of the circle be 220 units?
The number of people in various age groups in a town is given in the following table.
| Age group | 1-14 | 15-29 | 30-44 | 45-59 | 60-74 | 75 and above |
| Number of persons | 2 lakhs |
1 lakh |
1 lakh |
1 lakh |
80 thousand | 40 thousand |
Draw a bar graph to represent the above information and answer the following questions. (take 1 unit length = 20 thousands)
- Which two age groups have the same population?
- All persons in the age group of 60 and above are called senior citizens. How many senior citizens are there in the town?
A bar graph shows Gujiya (13 students), Jalebi (6 students), and Barfi (3 students). Which sweet is least preferred based on bar height?
