Advertisements
Advertisements
Question
The number of bags of rice sold by a shop on a certain week was as follows:
| Week days | Monday | Tuesday | Wednesday | Thursday | Friday | Saturday |
| Rice bags sold | 74 | 86 | 78 | 61 | 72 | 97 |
Draw a bar chart for this data.
Chart
Advertisements
Solution
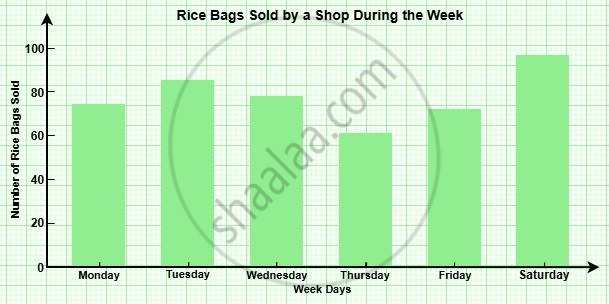
Here is the bar chart showing the number of rice bags sold by a shop during the week. As seen, Saturday had the highest sales (97 bags), while Thursday had the lowest (61 bags).
shaalaa.com
Is there an error in this question or solution?
