Advertisements
Advertisements
Question
The following table shows the market position of different brands of Talcum Powders.
| Brand | A | B | C | Others |
| % Buyers | 50 | 25 | 15 | 10 |
Draw a bar graph.
Graph
Advertisements
Solution
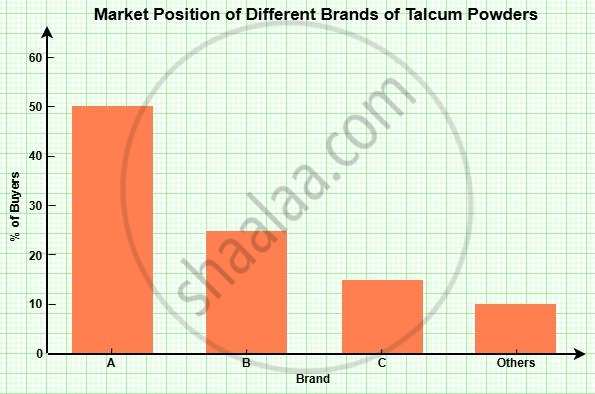
Here is the bar graph representing the market position of different brands of talcum powders based on the percentage of buyers. Brand A is the most preferred, followed by Brand B, Brand C and then Others.
shaalaa.com
Is there an error in this question or solution?
