English

The Given Graph Shows the Variation of Photo-electric Current (I) Versus Applied Voltage (V) for Two Difference Photosensitive Materials and for Two Different Intensities of the Incident Radiations. - Physics

Advertisements
Advertisements

Question

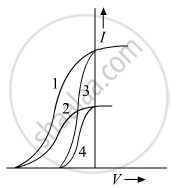
The given graph shows the variation of photo-electric current (I) versus applied voltage (V) for two difference photosensitive materials and for two different intensities of the incident radiations. Identify the pairs of curves that correspond to different materials but same intensity of incident radiation.

Advertisements

Solution

Curves 1 and 2 correspond to similar materials while curves 3 and 4 represent different materials, since the value of stopping potential for the pair of curves (1 and 2) & (3 and 4) are the same. For given frequency of the incident radiation the stopping potential is independent of its intensity.

So, the pairs of curves (1 and 3) and (2 and 4) correspond to different materials but same intensity of incident radiation.

shaalaa.com
  Is there an error in this question or solution?
2012-2013 (March) Delhi Set 2

Video TutorialsVIEW ALL [1]

RELATED QUESTIONS

The voltage and current in a series AC circuit are given by V = V0cos ωt and i = i0 sin ωt. What is the power dissipated in the circuit?


Two alternating currents are given by `i_1 = i_0 sin wt and i_2 = i_0 sin (wt + pi/3)` Will the rms values of the currents be equal or different?


A constant current of 2.8 A exists in a resistor. The rms current is


The household supply of electricity is at 220 V (rms value) and 50 Hz. Find the peak voltage and the least possible time in which the voltage can change from the rms value to zero.


A resistor of resistance 100 Ω is connected to an AC source ε = (12 V) sin (250 π s−1)t. Find the energy dissipated as heat during t = 0 to t = 1.0 ms.


A circuit containing a 80 mH inductor and a 60 µF capacitor in series is connected to a 230 V, 50 Hz supply. The resistance of the circuit is negligible.

(a) Obtain the current amplitude and rms values.

(b) Obtain the rms values of potential drops across each element.

(c) What is the average power transferred to the inductor?

(d) What is the average power transferred to the capacitor?

(e) What is the total average power absorbed by the circuit?
[‘Average’ implies ‘averaged over one cycle’.]


Phase diffn between voltage and current in a capacitor in A.C Circuit is.


In a transformer Np = 500, Ns = 5000. Input voltage is 20 volt and frequency is 50 HZ. Then in the output, we have,


The output of a step-down transformer is measured to be 24 V when connected to a 12-watt light bulb. The value of the peak current is ______.


In the Figure below, the current-voltage graphs for a conductor are given at two different temperatures, T1 and T2.


  1. At which temperature T1 or T2 is the resistance higher?
  2. Which temperature (T1 or T2) is higher?

Share
Notifications

Englishहिंदीमराठी


      Forgot password?
Use app×